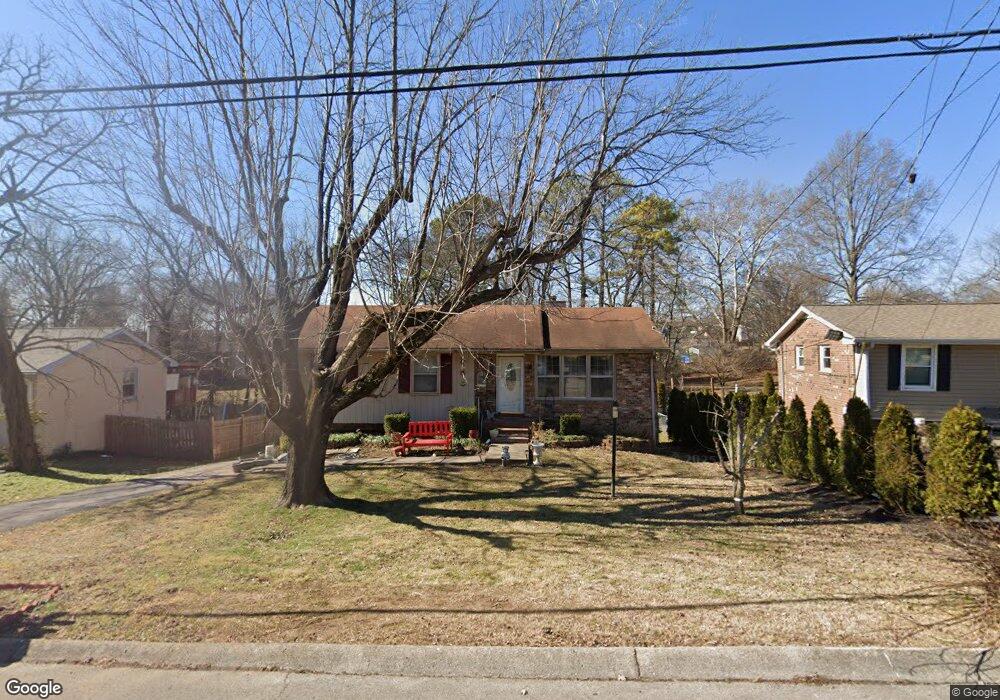
5009 Mclendon Dr Antioch, TN 37013
Fairlane NeighborhoodEstimated Value: $364,418 - $415,000
3
Beds
2
Baths
2,223
Sq Ft
$175/Sq Ft
Est. Value
About This Home
This home is located at 5009 Mclendon Dr, Antioch, TN 37013 and is currently estimated at $389,105, approximately $175 per square foot. 5009 Mclendon Dr is a home located in Davidson County with nearby schools including Cole Elementary School, Antioch Middle School, and Cane Ridge High School.
Ownership History
Date
Name
Owned For
Owner Type
Purchase Details
Closed on
Jun 6, 2012
Sold by
Bligh Michael S
Bought by
Torres Jorge L
Current Estimated Value
Home Financials for this Owner
Home Financials are based on the most recent Mortgage that was taken out on this home.
Original Mortgage
$125,681
Outstanding Balance
$86,774
Interest Rate
3.75%
Mortgage Type
FHA
Estimated Equity
$302,331
Purchase Details
Closed on
Mar 23, 2011
Sold by
Bonilla Anibal J
Bought by
Bligh Michael S and Bonilla Revocable Living Trust
Purchase Details
Closed on
Dec 9, 2006
Sold by
Bonilla Melgar Roberto A
Bought by
Bonilla Anibal J
Purchase Details
Closed on
Jul 8, 2005
Sold by
Dixon David M and Dixon Naomi J
Bought by
Bonilla Anibel J and Bonilla Melgar Roberto A
Home Financials for this Owner
Home Financials are based on the most recent Mortgage that was taken out on this home.
Original Mortgage
$141,878
Interest Rate
5.54%
Mortgage Type
FHA
Purchase Details
Closed on
Feb 28, 1995
Sold by
Jester Harry D
Bought by
Dixon David M
Create a Home Valuation Report for This Property
The Home Valuation Report is an in-depth analysis detailing your home's value as well as a comparison with similar homes in the area
Home Values in the Area
Average Home Value in this Area
Purchase History
| Date | Buyer | Sale Price | Title Company |
|---|---|---|---|
| Torres Jorge L | $128,000 | None Available | |
| Bligh Michael S | -- | None Available | |
| Bonilla Anibal J | -- | None Available | |
| Bonilla Anibel J | $143,000 | Southern Title Services | |
| Dixon David M | $90,000 | -- |
Source: Public Records
Mortgage History
| Date | Status | Borrower | Loan Amount |
|---|---|---|---|
| Open | Torres Jorge L | $125,681 | |
| Previous Owner | Bonilla Anibel J | $141,878 |
Source: Public Records
Tax History Compared to Growth
Tax History
| Year | Tax Paid | Tax Assessment Tax Assessment Total Assessment is a certain percentage of the fair market value that is determined by local assessors to be the total taxable value of land and additions on the property. | Land | Improvement |
|---|---|---|---|---|
| 2024 | $1,776 | $54,575 | $11,250 | $43,325 |
| 2023 | $1,776 | $54,575 | $11,250 | $43,325 |
| 2022 | $1,776 | $54,575 | $11,250 | $43,325 |
| 2021 | $1,794 | $54,575 | $11,250 | $43,325 |
| 2020 | $1,782 | $42,225 | $8,500 | $33,725 |
| 2019 | $1,332 | $42,225 | $8,500 | $33,725 |
| 2018 | $1,332 | $42,225 | $8,500 | $33,725 |
| 2017 | $1,332 | $42,225 | $8,500 | $33,725 |
| 2016 | $1,217 | $26,950 | $6,000 | $20,950 |
| 2015 | $1,217 | $26,950 | $6,000 | $20,950 |
| 2014 | $1,217 | $26,950 | $6,000 | $20,950 |
Source: Public Records
Map
Nearby Homes
- 5001 Mclendon Dr
- 4916 Olivia Dr
- 161 Tusculum Rd
- 4876 Cimarron Way
- 125 Robert Yoest Dr
- 174 Brenda Ln
- 304 Jenny Murff Dr
- 141 Colemont Dr
- 4985 Shihmen Dr
- 716 Muskhogean Ct
- 90 Tusculum Rd
- 4101 Eastview Dr
- 4712 Arapaho Bend
- 612 Roxanne Dr
- 4952 Shihmen Dr
- 121 Tomarand Rd
- 565 Michele Dr
- 564 Brook View Estates Dr
- 237 Ocala Dr
- 73 Tusculum Rd