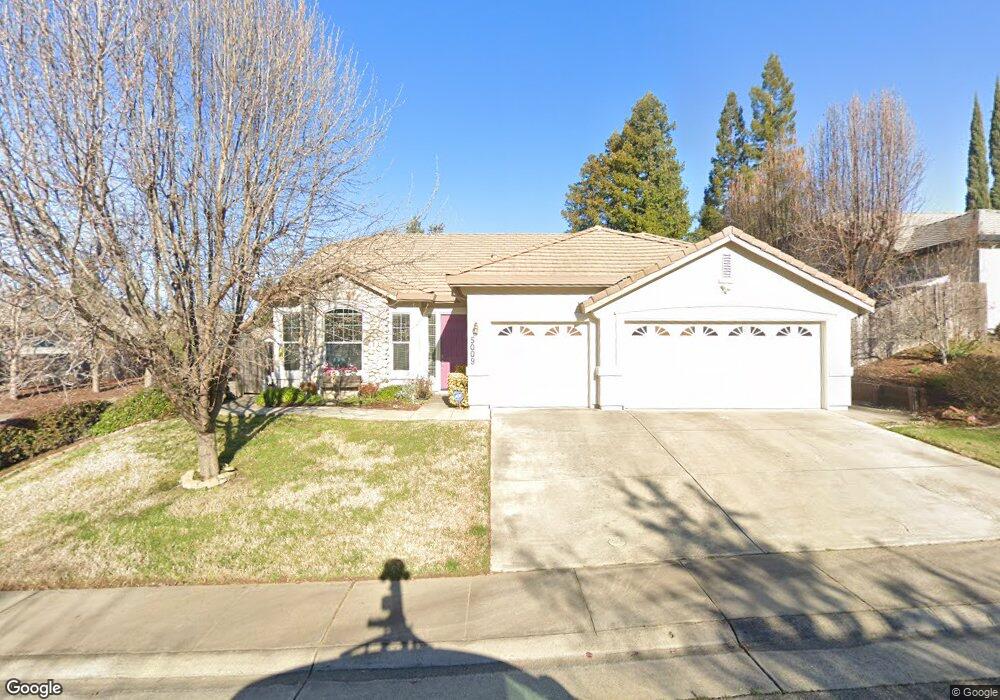
5009 Osgood Way Fair Oaks, CA 95628
Estimated Value: $733,000 - $920,000
5
Beds
3
Baths
2,642
Sq Ft
$308/Sq Ft
Est. Value
About This Home
This home is located at 5009 Osgood Way, Fair Oaks, CA 95628 and is currently estimated at $813,098, approximately $307 per square foot. 5009 Osgood Way is a home located in Sacramento County with nearby schools including Northridge Elementary School, Andrew Carnegie Middle School, and Bella Vista High School.
Ownership History
Date
Name
Owned For
Owner Type
Purchase Details
Closed on
May 5, 2005
Sold by
Scoggins Jerry N and Scott Nancy C
Bought by
Scoggins Jerry Neil and Scott Nancy Carolyn
Current Estimated Value
Purchase Details
Closed on
Mar 11, 2003
Sold by
Scoggins Jerry N and Scott Nancy C
Bought by
Scoggins Jerry N and Scott Nancy C
Home Financials for this Owner
Home Financials are based on the most recent Mortgage that was taken out on this home.
Original Mortgage
$100,000
Outstanding Balance
$42,833
Interest Rate
5.83%
Estimated Equity
$770,265
Purchase Details
Closed on
Mar 9, 1999
Sold by
Beazer Homes Holdings Corp
Bought by
Scoggins Jerry N and Scott Nancy C
Home Financials for this Owner
Home Financials are based on the most recent Mortgage that was taken out on this home.
Original Mortgage
$115,000
Interest Rate
6.79%
Create a Home Valuation Report for This Property
The Home Valuation Report is an in-depth analysis detailing your home's value as well as a comparison with similar homes in the area
Home Values in the Area
Average Home Value in this Area
Purchase History
| Date | Buyer | Sale Price | Title Company |
|---|---|---|---|
| Scoggins Jerry Neil | -- | -- | |
| Scoggins Jerry N | -- | Financial Title Company | |
| Scoggins Jerry N | $255,000 | First American Title Ins Co |
Source: Public Records
Mortgage History
| Date | Status | Borrower | Loan Amount |
|---|---|---|---|
| Open | Scoggins Jerry N | $100,000 | |
| Closed | Scoggins Jerry N | $115,000 |
Source: Public Records
Tax History Compared to Growth
Tax History
| Year | Tax Paid | Tax Assessment Tax Assessment Total Assessment is a certain percentage of the fair market value that is determined by local assessors to be the total taxable value of land and additions on the property. | Land | Improvement |
|---|---|---|---|---|
| 2025 | $4,803 | $399,016 | $117,565 | $281,451 |
| 2024 | $4,803 | $391,193 | $115,260 | $275,933 |
| 2023 | $4,663 | $383,523 | $113,000 | $270,523 |
| 2022 | $4,644 | $376,004 | $110,785 | $265,219 |
| 2021 | $4,554 | $368,632 | $108,613 | $260,019 |
| 2020 | $4,489 | $364,853 | $107,500 | $257,353 |
| 2019 | $4,375 | $357,700 | $105,393 | $252,307 |
| 2018 | $4,278 | $350,687 | $103,327 | $247,360 |
| 2017 | $4,235 | $343,811 | $101,301 | $242,510 |
| 2016 | $3,959 | $337,070 | $99,315 | $237,755 |
| 2015 | $3,891 | $332,008 | $97,824 | $234,184 |
| 2014 | $3,809 | $325,505 | $95,908 | $229,597 |
Source: Public Records
Map
Nearby Homes
- 5020 Cozzins Ct
- 5101 Cocoa Palm Way
- 5137 Kauai Way
- 5343 Maui Way
- 11330 Fair Oaks Blvd
- 11330 Fair Oaks Blvd Unit 102A
- 5001 Shamrock Dr
- 4924 Buena Vista Ave
- 7948- Sunset Ave
- 8366 Madison Ave
- 8072 Dorian Way
- 8140 Maderia Port Ln
- 5137 Kenneth Ave
- 8464 Sunset Ave
- 8461 Caslan Ave
- 8028 Vintage Way
- 8063 Youngheart Ln
- 5453 Ventana Place
- 8075 Vintage Way
- 8076 Vintage Way
- 5021 Osgood Way
- 8210 Bramhall Way
- 8241 Smith Farm Ct
- 5021 Cozzins Ct
- 5034 Blanchard Ct
- 8218 Bramhall Way
- 8237 Smith Farm Ct
- 5014 Osgood Way
- 5020 Osgood Way
- 5037 Osgood Way
- 5026 Osgood Way
- 8301 Yvonne Way
- 8231 Smith Farm Ct
- 5032 Osgood Way
- 8260 Bramhall Way
- 4977 Chicago Ave
- 8226 Bramhall Way
- 5049 Osgood Way
- 5033 Chicago Ave
- 8313 Yvonne Way