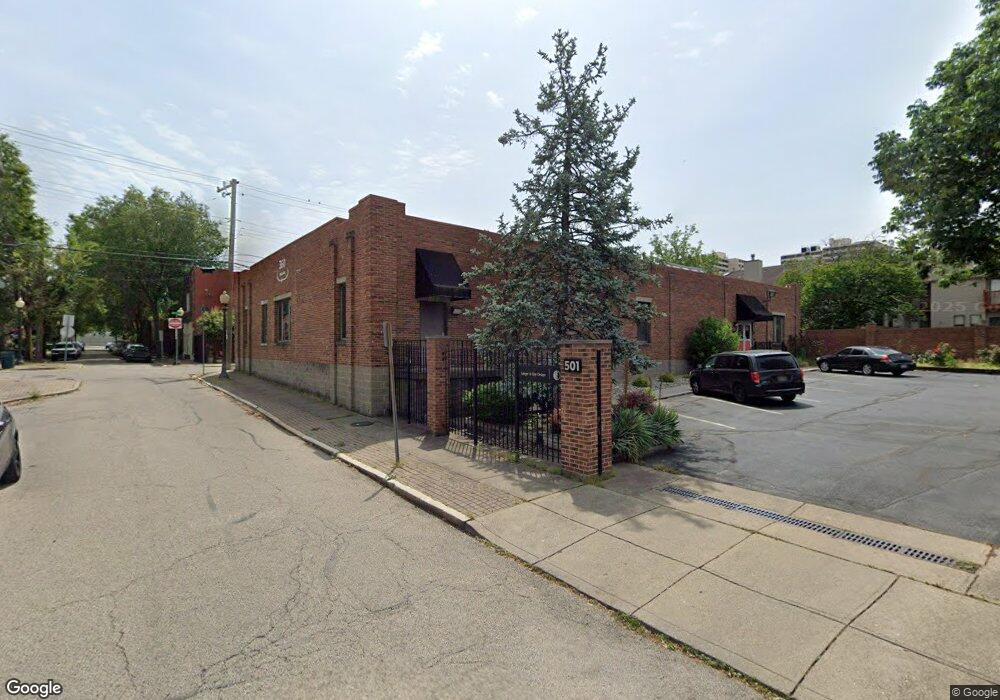
501 Chestnut St Cincinnati, OH 45203
West End NeighborhoodEstimated Value: $999,209
--
Bed
2
Baths
6,324
Sq Ft
$158/Sq Ft
Est. Value
About This Home
This home is located at 501 Chestnut St, Cincinnati, OH 45203 and is currently estimated at $999,209, approximately $158 per square foot. 501 Chestnut St is a home located in Hamilton County with nearby schools including Hays-Porter School, Robert A. Taft Information Technology High School, and Gilbert A. Dater High School.
Ownership History
Date
Name
Owned For
Owner Type
Purchase Details
Closed on
Nov 9, 2023
Sold by
Sanger & Eby Llc
Bought by
360 Total Care Llc
Current Estimated Value
Home Financials for this Owner
Home Financials are based on the most recent Mortgage that was taken out on this home.
Original Mortgage
$720,000
Outstanding Balance
$486,611
Interest Rate
7.49%
Mortgage Type
Credit Line Revolving
Estimated Equity
$512,598
Purchase Details
Closed on
Dec 8, 2000
Sold by
Ray Washick
Bought by
Sanger & Eby Llc
Home Financials for this Owner
Home Financials are based on the most recent Mortgage that was taken out on this home.
Original Mortgage
$350,000
Interest Rate
7.7%
Mortgage Type
Commercial
Purchase Details
Closed on
Jun 2, 1994
Sold by
City Of Cincinnati
Bought by
Washick Ray
Create a Home Valuation Report for This Property
The Home Valuation Report is an in-depth analysis detailing your home's value as well as a comparison with similar homes in the area
Home Values in the Area
Average Home Value in this Area
Purchase History
| Date | Buyer | Sale Price | Title Company |
|---|---|---|---|
| 360 Total Care Llc | $900,000 | None Listed On Document | |
| Sanger & Eby Llc | $380,000 | -- | |
| Washick Ray | -- | -- |
Source: Public Records
Mortgage History
| Date | Status | Borrower | Loan Amount |
|---|---|---|---|
| Open | 360 Total Care Llc | $720,000 | |
| Previous Owner | Sanger & Eby Llc | $350,000 |
Source: Public Records
Tax History Compared to Growth
Tax History
| Year | Tax Paid | Tax Assessment Tax Assessment Total Assessment is a certain percentage of the fair market value that is determined by local assessors to be the total taxable value of land and additions on the property. | Land | Improvement |
|---|---|---|---|---|
| 2024 | $12,594 | $149,804 | $14,371 | $135,433 |
| 2023 | $12,563 | $149,804 | $14,371 | $135,433 |
| 2022 | $13,501 | $146,122 | $15,484 | $130,638 |
| 2021 | $13,054 | $146,122 | $15,484 | $130,638 |
| 2020 | $13,068 | $146,122 | $15,484 | $130,638 |
| 2019 | $11,327 | $116,897 | $12,387 | $104,510 |
| 2018 | $11,333 | $116,897 | $12,387 | $104,510 |
| 2017 | $10,973 | $116,897 | $12,387 | $104,510 |
| 2016 | $10,973 | $114,538 | $12,817 | $101,721 |
| 2015 | $10,084 | $114,538 | $12,817 | $101,721 |
| 2014 | $10,118 | $114,538 | $12,817 | $101,721 |
| 2013 | $6,231 | $116,876 | $13,080 | $103,796 |
Source: Public Records
Map
Nearby Homes
- 439 Chestnut St
- 504 Elizabeth St
- 506 Elizabeth St
- 442 Chestnut St
- 502 Elizabeth St
- 510 Elizabeth St
- 437 Chestnut St
- 508 Elizabeth St
- 512 Elizabeth St
- 446 Chestnut St
- 435 Chestnut St
- 1036 Mound St
- 1034 Mound St
- 438 Elizabeth St
- 514 Elizabeth St
- 1032 Mound St
- 433 Chestnut St
- 1046 Mound St
- 440 Chestnut St
- 1030 Mound St