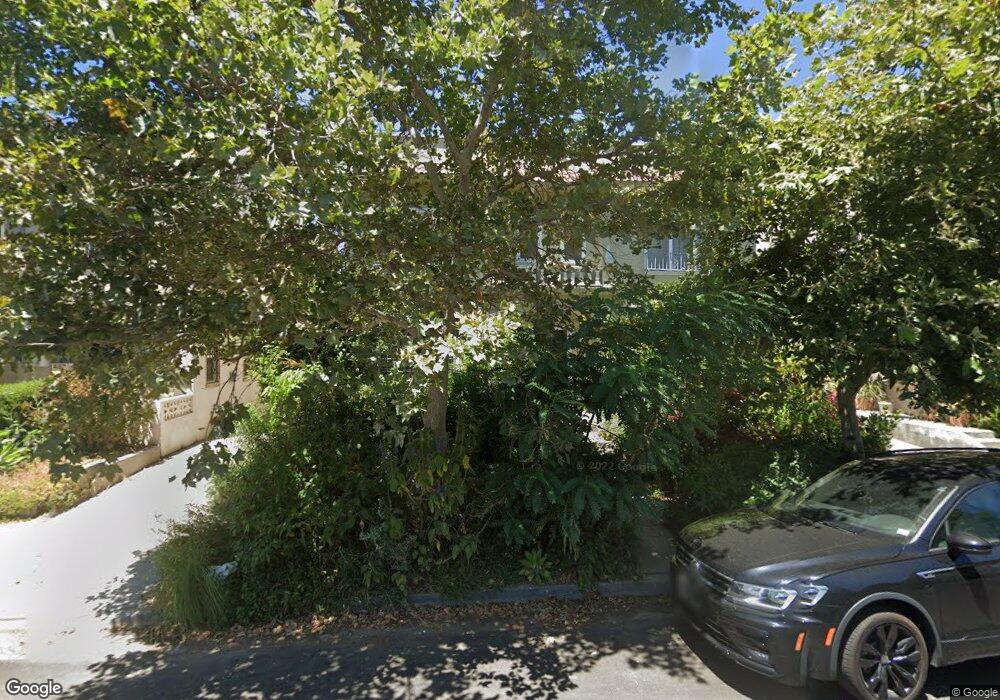
501 N Norton Ave Los Angeles, CA 90004
Larchmont NeighborhoodEstimated Value: $1,500,000 - $1,997,000
4
Beds
4
Baths
3,888
Sq Ft
$426/Sq Ft
Est. Value
About This Home
This home is located at 501 N Norton Ave, Los Angeles, CA 90004 and is currently estimated at $1,656,750, approximately $426 per square foot. 501 N Norton Ave is a home located in Los Angeles County with nearby schools including Van Ness Avenue Elementary School, Joseph Le Conte Middle School, and Fairfax High School.
Ownership History
Date
Name
Owned For
Owner Type
Purchase Details
Closed on
Apr 10, 2013
Sold by
Birchall Paul
Bought by
Fredrickson Lang and Birchall Paul
Current Estimated Value
Home Financials for this Owner
Home Financials are based on the most recent Mortgage that was taken out on this home.
Original Mortgage
$723,750
Outstanding Balance
$510,869
Interest Rate
3.47%
Mortgage Type
New Conventional
Estimated Equity
$1,145,881
Purchase Details
Closed on
Mar 26, 2007
Sold by
Stanhope Warren and Stanhope Patrick Gerardine
Bought by
Birchall Paul
Home Financials for this Owner
Home Financials are based on the most recent Mortgage that was taken out on this home.
Original Mortgage
$775,200
Interest Rate
9%
Mortgage Type
Negative Amortization
Purchase Details
Closed on
Feb 21, 2007
Sold by
Spratt Elaine and Rosemary H Osburn Trust
Bought by
Stanhope Warren
Home Financials for this Owner
Home Financials are based on the most recent Mortgage that was taken out on this home.
Original Mortgage
$775,200
Interest Rate
9%
Mortgage Type
Negative Amortization
Create a Home Valuation Report for This Property
The Home Valuation Report is an in-depth analysis detailing your home's value as well as a comparison with similar homes in the area
Home Values in the Area
Average Home Value in this Area
Purchase History
| Date | Buyer | Sale Price | Title Company |
|---|---|---|---|
| Fredrickson Lang | -- | Lsi | |
| Birchall Paul | $964,000 | California Title Company | |
| Stanhope Warren | -- | None Available |
Source: Public Records
Mortgage History
| Date | Status | Borrower | Loan Amount |
|---|---|---|---|
| Open | Fredrickson Lang | $723,750 | |
| Closed | Birchall Paul | $775,200 |
Source: Public Records
Tax History Compared to Growth
Tax History
| Year | Tax Paid | Tax Assessment Tax Assessment Total Assessment is a certain percentage of the fair market value that is determined by local assessors to be the total taxable value of land and additions on the property. | Land | Improvement |
|---|---|---|---|---|
| 2025 | $15,735 | $1,291,541 | $1,023,593 | $267,948 |
| 2024 | $15,735 | $1,266,218 | $1,003,523 | $262,695 |
| 2023 | $15,437 | $1,241,392 | $983,847 | $257,545 |
| 2022 | $14,730 | $1,217,052 | $964,556 | $252,496 |
| 2021 | $14,535 | $1,193,190 | $945,644 | $247,546 |
| 2020 | $14,681 | $1,180,956 | $935,948 | $245,008 |
| 2019 | $14,104 | $1,157,801 | $917,597 | $240,204 |
| 2018 | $13,994 | $1,135,100 | $899,605 | $235,495 |
| 2016 | $13,363 | $1,091,024 | $864,673 | $226,351 |
| 2015 | $13,170 | $1,074,636 | $851,685 | $222,951 |
| 2014 | $13,231 | $1,053,586 | $835,002 | $218,584 |
Source: Public Records
Map
Nearby Homes
- 441 N Norton Ave
- 516 N Bronson Ave
- 5021 Elmwood Ave
- 5010 Elmwood Ave
- 362 N Norton Ave
- 5132 Maplewood Ave Unit 106
- 5037 Rosewood Ave Unit 308
- 5014 Rosewood Ave Unit 1/2
- 584 N Plymouth Blvd
- 5143 La Vista Ct
- 312 N Bronson Ave
- 5115 Clinton St Unit 1
- 4705 - 4709 Elmwood Ave
- 4942 Rosewood Ave
- 408 N Beachwood Dr
- 253 N Irving Blvd
- 226 N Irving Blvd
- 723 N Ridgewood Place
- 234 N Ridgewood Place
- 326 N Gower St
- 465 N Norton Ave
- 507 N Norton Ave
- 463 N Norton Ave
- 513 N Norton Ave
- 552 N Bronson Ave
- 548 N Bronson Ave
- 556 N Bronson Ave
- 542 N Bronson Ave
- 562 N Bronson Ave
- 455 N Norton Ave
- 517 N Norton Ave
- 457 N Norton Ave
- 502 1/2 N Bronson Ave
- 502 N Bronson Ave Unit 1/2
- 502 N Bronson Ave
- 538 N Bronson Ave
- 568 N Bronson Ave
- 451 N Norton Ave
- 523 N Norton Ave
- 534 N Bronson Ave