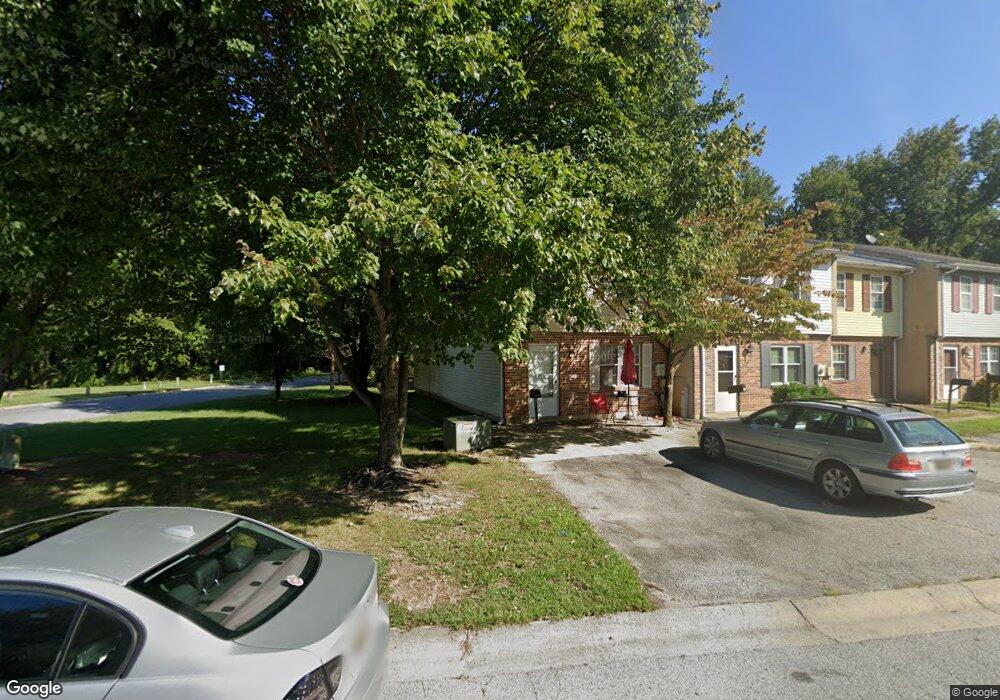
501 Stewarton Ct Newark, DE 19702
Estimated Value: $195,000 - $273,000
3
Beds
1
Bath
1,378
Sq Ft
$175/Sq Ft
Est. Value
About This Home
This home is located at 501 Stewarton Ct, Newark, DE 19702 and is currently estimated at $240,522, approximately $174 per square foot. 501 Stewarton Ct is a home located in New Castle County with nearby schools including Keene (William B.) Elementary School, Gauger-Cobbs Middle School, and Glasgow High School.
Ownership History
Date
Name
Owned For
Owner Type
Purchase Details
Closed on
Aug 6, 2010
Sold by
Johnson Samuel Q and Johnson Julie D
Bought by
Ckq Properties Llc
Current Estimated Value
Purchase Details
Closed on
Oct 27, 2006
Sold by
Johniken Damon L
Bought by
Johnson Samuel Q and Johnson Julie D
Purchase Details
Closed on
Jul 14, 2006
Sold by
Cramer Nicole Denise
Bought by
Johniken Damon
Home Financials for this Owner
Home Financials are based on the most recent Mortgage that was taken out on this home.
Original Mortgage
$108,000
Interest Rate
11.87%
Mortgage Type
New Conventional
Purchase Details
Closed on
Feb 15, 2002
Sold by
Fuller Dorothy M
Bought by
Cramer Nicole Denise
Home Financials for this Owner
Home Financials are based on the most recent Mortgage that was taken out on this home.
Original Mortgage
$81,257
Interest Rate
7.14%
Mortgage Type
FHA
Create a Home Valuation Report for This Property
The Home Valuation Report is an in-depth analysis detailing your home's value as well as a comparison with similar homes in the area
Home Values in the Area
Average Home Value in this Area
Purchase History
| Date | Buyer | Sale Price | Title Company |
|---|---|---|---|
| Ckq Properties Llc | -- | None Available | |
| Johnson Samuel Q | $127,500 | None Available | |
| Johniken Damon | $120,000 | None Available | |
| Cramer Nicole Denise | $81,900 | -- |
Source: Public Records
Mortgage History
| Date | Status | Borrower | Loan Amount |
|---|---|---|---|
| Previous Owner | Johniken Damon | $108,000 | |
| Previous Owner | Cramer Nicole Denise | $81,257 | |
| Closed | Cramer Nicole Denise | $5,000 |
Source: Public Records
Tax History Compared to Growth
Tax History
| Year | Tax Paid | Tax Assessment Tax Assessment Total Assessment is a certain percentage of the fair market value that is determined by local assessors to be the total taxable value of land and additions on the property. | Land | Improvement |
|---|---|---|---|---|
| 2024 | $1,745 | $39,700 | $10,000 | $29,700 |
| 2023 | $1,699 | $39,700 | $10,000 | $29,700 |
| 2022 | $1,687 | $39,700 | $10,000 | $29,700 |
| 2021 | $1,651 | $39,700 | $10,000 | $29,700 |
| 2020 | $1,606 | $39,700 | $10,000 | $29,700 |
| 2019 | $1,938 | $39,700 | $10,000 | $29,700 |
| 2018 | $1,392 | $39,700 | $10,000 | $29,700 |
| 2017 | $1,344 | $39,700 | $10,000 | $29,700 |
| 2016 | $1,334 | $39,700 | $10,000 | $29,700 |
| 2015 | $1,220 | $39,700 | $10,000 | $29,700 |
| 2014 | $1,220 | $39,700 | $10,000 | $29,700 |
Source: Public Records
Map
Nearby Homes
- 16 Barberry Ct Unit A016
- 23 Barberry Ct
- 113 Dufferin Dr
- 115 Whitburn Place
- 200 Birch Ln
- 717 Lexington Dr
- 208 Yosemite Dr
- 1791 Pulaski Hwy
- 107 Rushmore Ct
- 78 Lake Tahoe Cir
- 915 Rue Madora
- 14 Pimlico Ln
- 15 Pimlico Ln
- 1869 Bergerac Ct
- 22 Monferrato Ct
- 1850 Bergerac Ct
- 646 Corsica Ave
- 325 Jacobs Loop
- 1821 Bergerac Ct
- 1809 Bergerac Ct
- 503 Stewarton Ct
- 505 Stewarton Ct
- 507 Stewarton Ct
- 509 Stewarton Ct
- 504 Stewarton Ct
- 502 Stewarton Ct
- 500 Stewarton Ct
- 508 Stewarton Ct
- 510 Stewarton Ct
- 512 Stewarton Ct
- 601 Lockhaven Ct
- 514 Stewarton Ct
- 603 Lockhaven Ct
- 516 Stewarton Ct
- 605 Lockhaven Ct
- 518 Stewarton Ct
- 607 Lockhaven Ct
- 520 Stewarton Ct
- 609 Lockhaven Ct
- 522 Stewarton Ct