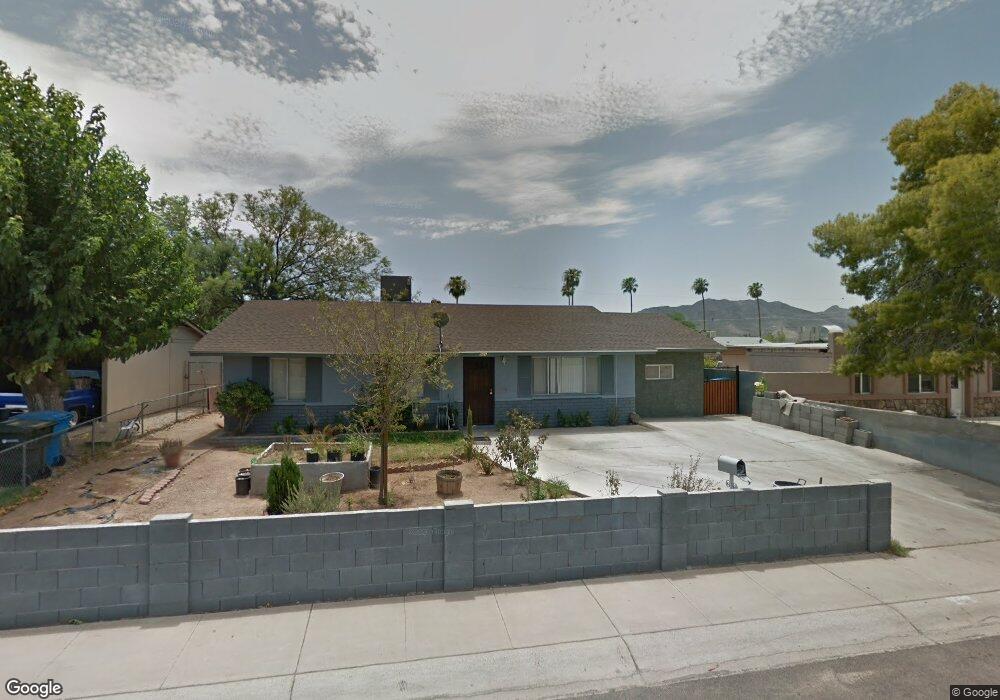
501 W Ardmore Rd Phoenix, AZ 85041
South Mountain NeighborhoodEstimated Value: $287,043 - $383,000
Studio
2
Baths
1,630
Sq Ft
$209/Sq Ft
Est. Value
About This Home
This home is located at 501 W Ardmore Rd, Phoenix, AZ 85041 and is currently estimated at $341,261, approximately $209 per square foot. 501 W Ardmore Rd is a home located in Maricopa County with nearby schools including Valley View School, Cesar Chavez High School, and Phoenix Coding Academy.
Ownership History
Date
Name
Owned For
Owner Type
Purchase Details
Closed on
Aug 30, 2002
Sold by
Alba Investment Group Llc
Bought by
Contreras Jorge and Contreras Juana C
Current Estimated Value
Home Financials for this Owner
Home Financials are based on the most recent Mortgage that was taken out on this home.
Original Mortgage
$99,900
Outstanding Balance
$41,884
Interest Rate
6.29%
Mortgage Type
New Conventional
Estimated Equity
$299,377
Purchase Details
Closed on
May 28, 2002
Sold by
Jackson Lathea D
Bought by
Alba Investment Group Llc
Purchase Details
Closed on
Feb 6, 1997
Sold by
Belland Opal L and Easter Kennard L
Bought by
Jackson Lathea D
Home Financials for this Owner
Home Financials are based on the most recent Mortgage that was taken out on this home.
Original Mortgage
$52,403
Interest Rate
7.85%
Mortgage Type
Seller Take Back
Create a Home Valuation Report for This Property
The Home Valuation Report is an in-depth analysis detailing your home's value as well as a comparison with similar homes in the area
Home Values in the Area
Average Home Value in this Area
Purchase History
We collect this data history from publicly available records. To have your information removed, we recommend requesting removal directly through your county’s website.
| Date | Buyer | Sale Price | Title Company |
|---|---|---|---|
| Contreras Jorge | $109,900 | Century Title Agency Inc | |
| Alba Investment Group Llc | $81,000 | Century Title Agency Inc | |
| Jackson Lathea D | $53,000 | Grand Canyon Title Agency In |
Source: Public Records
Mortgage History
We collect this data history from publicly available records. To have your information removed, we recommend requesting removal directly through your county’s website.
| Date | Status | Borrower | Loan Amount |
|---|---|---|---|
| Open | Contreras Jorge | $99,900 | |
| Previous Owner | Jackson Lathea D | $52,403 |
Source: Public Records
Tax History
| Year | Tax Paid | Tax Assessment Tax Assessment Total Assessment is a certain percentage of the fair market value that is determined by local assessors to be the total taxable value of land and additions on the property. | Land | Improvement |
|---|---|---|---|---|
| 2025 | $1,078 | $7,977 | -- | -- |
| 2024 | $1,019 | $7,597 | -- | -- |
| 2023 | $1,019 | $23,250 | $4,650 | $18,600 |
| 2022 | $998 | $17,330 | $3,460 | $13,870 |
| 2021 | $1,029 | $15,850 | $3,170 | $12,680 |
| 2020 | $1,016 | $14,610 | $2,920 | $11,690 |
| 2019 | $981 | $12,180 | $2,430 | $9,750 |
| 2018 | $953 | $11,580 | $2,310 | $9,270 |
| 2017 | $888 | $9,110 | $1,820 | $7,290 |
| 2016 | $843 | $8,330 | $1,660 | $6,670 |
| 2015 | $783 | $6,360 | $1,270 | $5,090 |
Source: Public Records
Map
Nearby Homes
- 301 W Desert Dr
- 231 W Winston Dr
- 817 W Ardmore Rd
- 221 W Winston Dr
- 8225 S 5th Ln
- 8511 S 9th Dr Unit 15
- 722 W Beth Dr
- 508 W Latona Rd
- 8514 S 9th Dr
- 8510 S 9th Dr Unit 20
- 1013 W Ardmore Rd
- 8025 S 5th Ave
- 141 W Latona Rd
- 615 W Harwell Rd
- 524 W Harwell Rd
- 9030 S 10th Dr
- 219 W Paseo Way
- 515 W La Mirada Dr
- 736 W Harwell Rd
- 606 W Beautiful Ln
- 425 W Ardmore Rd
- 509 W Ardmore Rd
- 510 W Desert Dr
- 502 W Desert Dr
- 421 W Ardmore Rd
- 516 W Desert Dr
- 424 W Ardmore Rd
- 8457 S 5th Dr
- 430 W Desert Dr Unit 3
- 522 W Desert Dr
- 8625 S 5th Dr
- 8453 S 5th Dr
- 8453 S 5th Dr
- 415 W Ardmore Rd
- 420 W Ardmore Rd
- 422 W Desert Dr
- 8447 S 5th Dr
- 414 W Ardmore Rd
- 409 W Ardmore Rd
- 509 W Desert Dr
Your Personal Tour Guide
Ask me questions while you tour the home.