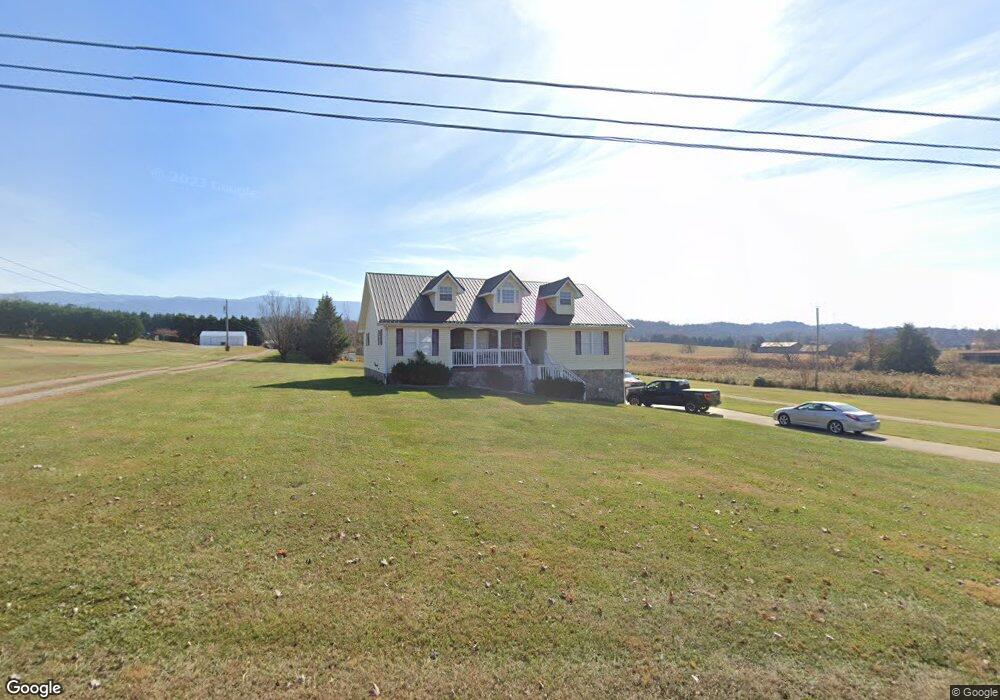
5015 107 Cutoff Greeneville, TN 37743
Estimated Value: $314,994 - $437,000
--
Bed
3
Baths
1,640
Sq Ft
$223/Sq Ft
Est. Value
About This Home
This home is located at 5015 107 Cutoff, Greeneville, TN 37743 and is currently estimated at $365,999, approximately $223 per square foot. 5015 107 Cutoff is a home located in Greene County with nearby schools including Camp Creek Elementary School, South Greene Middle School, and South Greene High School.
Ownership History
Date
Name
Owned For
Owner Type
Purchase Details
Closed on
Nov 15, 2013
Sold by
Padzinski Richard P
Bought by
Harris Douglas M and Harris Roseann J
Current Estimated Value
Home Financials for this Owner
Home Financials are based on the most recent Mortgage that was taken out on this home.
Original Mortgage
$88,000
Outstanding Balance
$65,834
Interest Rate
4.31%
Mortgage Type
Commercial
Estimated Equity
$300,165
Purchase Details
Closed on
Aug 28, 2008
Sold by
Morris David E
Bought by
Padzinski Richard P
Purchase Details
Closed on
Oct 2, 2006
Sold by
Goodwin Samuel L
Bought by
Morris David E
Home Financials for this Owner
Home Financials are based on the most recent Mortgage that was taken out on this home.
Original Mortgage
$123,910
Interest Rate
6.36%
Purchase Details
Closed on
Jul 25, 2005
Sold by
Shipley Billy D
Bought by
Goodwin Samuel L
Purchase Details
Closed on
Sep 13, 2004
Sold by
Hinkle Coy
Bought by
Shipley Billy D
Create a Home Valuation Report for This Property
The Home Valuation Report is an in-depth analysis detailing your home's value as well as a comparison with similar homes in the area
Home Values in the Area
Average Home Value in this Area
Purchase History
| Date | Buyer | Sale Price | Title Company |
|---|---|---|---|
| Harris Douglas M | $154,000 | -- | |
| Padzinski Richard P | $154,000 | -- | |
| Morris David E | $159,900 | -- | |
| Goodwin Samuel L | $150,000 | -- | |
| Shipley Billy D | $12,500 | -- |
Source: Public Records
Mortgage History
| Date | Status | Borrower | Loan Amount |
|---|---|---|---|
| Open | Harris Douglas M | $88,000 | |
| Previous Owner | Shipley Billy D | $123,910 |
Source: Public Records
Tax History Compared to Growth
Tax History
| Year | Tax Paid | Tax Assessment Tax Assessment Total Assessment is a certain percentage of the fair market value that is determined by local assessors to be the total taxable value of land and additions on the property. | Land | Improvement |
|---|---|---|---|---|
| 2024 | $1,097 | $66,500 | $5,750 | $60,750 |
| 2023 | $1,097 | $66,500 | $0 | $0 |
| 2022 | $753 | $37,400 | $3,350 | $34,050 |
| 2021 | $744 | $36,950 | $3,350 | $33,600 |
| 2020 | $744 | $36,950 | $3,350 | $33,600 |
| 2019 | $744 | $36,950 | $3,350 | $33,600 |
| 2018 | $744 | $36,950 | $3,350 | $33,600 |
| 2017 | $750 | $38,000 | $3,350 | $34,650 |
| 2016 | $712 | $38,000 | $3,350 | $34,650 |
| 2015 | $712 | $38,000 | $3,350 | $34,650 |
| 2014 | $712 | $38,000 | $3,350 | $34,650 |
Source: Public Records
Map
Nearby Homes
- 6110 Jones Bridge Rd
- 397 Jennings Ln
- 5675 Jones Bridge Rd
- 456 Greystone Rd
- 570 Stephen Brooks Rd
- 280 Camp Creek Rd
- 1510 Greystone Rd
- 00 Red Hill Rd
- 635 Ricker Rd
- 1915 Shakerag Rd
- 260 Dominique Ln
- Lot 7r Dominique Ln
- Lot 43 Belle Arden Dr
- 296 Belle Arden Dr
- 0 J Mell Johnson Rd
- 96 Belle Arden Dr
- 3625 Holly Creek Rd
- Lot 4r J Mell Johnson Rd
- 2335 Jones Bridge Rd
- 2570 Shiloh Rd Unit 4-8
- 5015 Cut Off
- 5015 Cutoff
- 4985 107 Cutoff
- 5190 107 Cutoff
- 5160 107 Cutoff
- 5035 107 Cutoff
- 5045 Tennessee 107 Cutoff
- 4995 107 Cutoff
- 4995 Cutoff
- 4930 107 Cutoff
- 4965 107 Cutoff
- 4905 107 Cutoff
- 75 Foxford Rd
- 5005 107 Cutoff
- 4860 Tennessee 107 Cutoff
- 5125 107 Cutoff
- 4835 107 Cutoff
- 4835 Tennessee 107 Cutoff
- 5045 107 Cutoff
- 4794 107 Cutoff