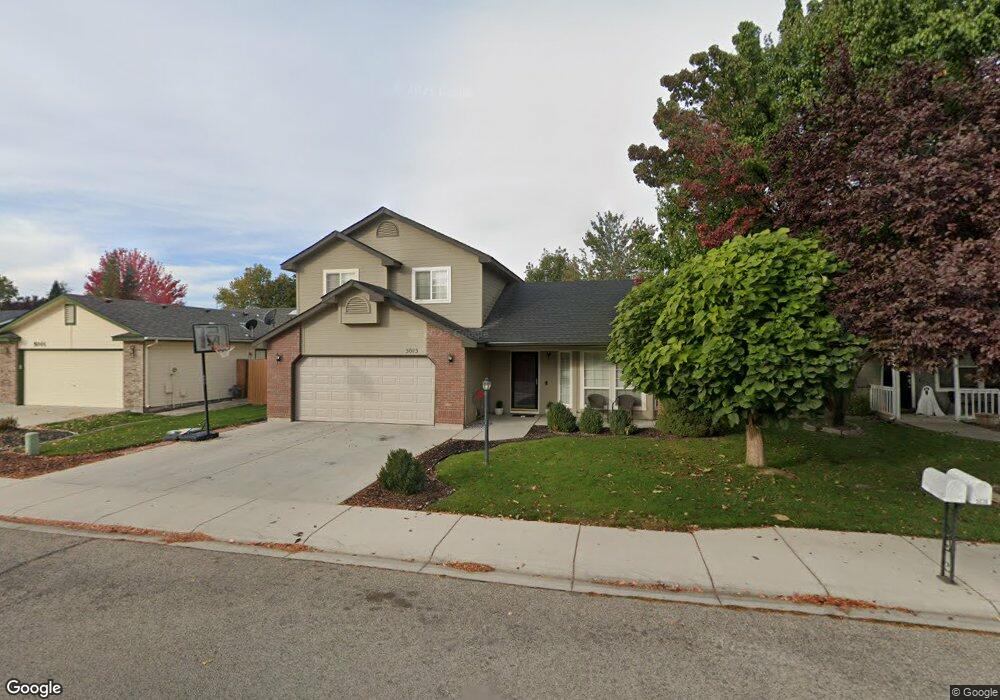
5015 N Ice Springs Way Boise, ID 83713
West Boise NeighborhoodEstimated Value: $414,000 - $466,000
3
Beds
3
Baths
1,545
Sq Ft
$285/Sq Ft
Est. Value
About This Home
This home is located at 5015 N Ice Springs Way, Boise, ID 83713 and is currently estimated at $440,151, approximately $284 per square foot. 5015 N Ice Springs Way is a home located in Ada County with nearby schools including Discovery Elementary School, Heritage Middle School, and Rocky Mountain High School.
Ownership History
Date
Name
Owned For
Owner Type
Purchase Details
Closed on
May 7, 2015
Sold by
Tiffany Chad A and Tiffany Angella
Bought by
Ice Springs Llc
Current Estimated Value
Purchase Details
Closed on
Jun 22, 2009
Sold by
Tiffany Chad and Tiffany Angella
Bought by
Tiffany Chad A and Tiffany Angella
Home Financials for this Owner
Home Financials are based on the most recent Mortgage that was taken out on this home.
Original Mortgage
$166,992
Interest Rate
4.83%
Mortgage Type
FHA
Purchase Details
Closed on
Oct 21, 1999
Sold by
Woodside Homes Inc
Bought by
Shakespeare Brent and Shakespeare Kristi
Home Financials for this Owner
Home Financials are based on the most recent Mortgage that was taken out on this home.
Original Mortgage
$109,831
Interest Rate
7.86%
Mortgage Type
FHA
Create a Home Valuation Report for This Property
The Home Valuation Report is an in-depth analysis detailing your home's value as well as a comparison with similar homes in the area
Home Values in the Area
Average Home Value in this Area
Purchase History
| Date | Buyer | Sale Price | Title Company |
|---|---|---|---|
| Ice Springs Llc | -- | Titleone | |
| Tiffany Chad A | -- | Title One | |
| Shakespeare Brent | -- | Transnation Title & Escrow I |
Source: Public Records
Mortgage History
| Date | Status | Borrower | Loan Amount |
|---|---|---|---|
| Previous Owner | Tiffany Chad A | $166,992 | |
| Previous Owner | Shakespeare Brent | $109,831 |
Source: Public Records
Tax History Compared to Growth
Tax History
| Year | Tax Paid | Tax Assessment Tax Assessment Total Assessment is a certain percentage of the fair market value that is determined by local assessors to be the total taxable value of land and additions on the property. | Land | Improvement |
|---|---|---|---|---|
| 2025 | $2,488 | $389,800 | -- | -- |
| 2024 | $2,473 | $374,800 | -- | -- |
| 2023 | $2,473 | $353,700 | $0 | $0 |
| 2022 | $2,895 | $427,400 | $0 | $0 |
| 2021 | $2,973 | $337,800 | $0 | $0 |
| 2020 | $2,613 | $261,000 | $0 | $0 |
| 2019 | $3,133 | $244,000 | $0 | $0 |
| 2018 | $2,981 | $209,300 | $0 | $0 |
| 2017 | $2,873 | $188,700 | $0 | $0 |
| 2016 | $2,730 | $174,900 | $0 | $0 |
| 2015 | $2,469 | $163,700 | $0 | $0 |
| 2012 | -- | $123,200 | $0 | $0 |
Source: Public Records
Map
Nearby Homes
- 2164 E Roaring Creek St
- 4985 N Rothmans Ave
- 5167 N Rothmans Ave
- 5282 N Schumann Ave
- 5174 N Rothmans Ave
- 5488 N Mendelson Ave
- 4902 N Schubert Ave
- 2578 E Granadillo Dr
- 2087 E Mountain Man Dr
- 2064 E Mozart St
- 5545 N Rothmans Ave
- 2231 E Elmsprings Ln
- 5674 N Heathrow Way
- 1950 E Trail Blazer Dr
- 14186 W Chadford Dr
- 14551 W Barclay St
- 14435 W Kensington Ct
- 13902 W Hartford Dr
- 14469 W Guinness Dr
- 5788 N Graham Ave
- 5039 N Ice Springs Way
- 5001 N Ice Springs Way
- 4998 N Mendelson Ave
- 4967 N
- 5020 N Mendelson Ave
- 4985 N Ice Springs Way
- 5053 N Ice Springs Way
- 5016 N Ice Springs Way
- 4976 N Mendelson Ave
- 5004 N Ice Springs Way
- 5042 N Mendelson Ave
- 5042 N Ice Springs Way
- 5067 N Ice Springs Way
- 4967 N Ice Springs Way
- 4990 N Ice Springs Way
- 5058 N Ice Springs Way
- 4954 N Mendelson Ave
- 4968 N Ice Springs Way
- 5064 N Mendelson Ave
- 5091 N Ice Springs Way