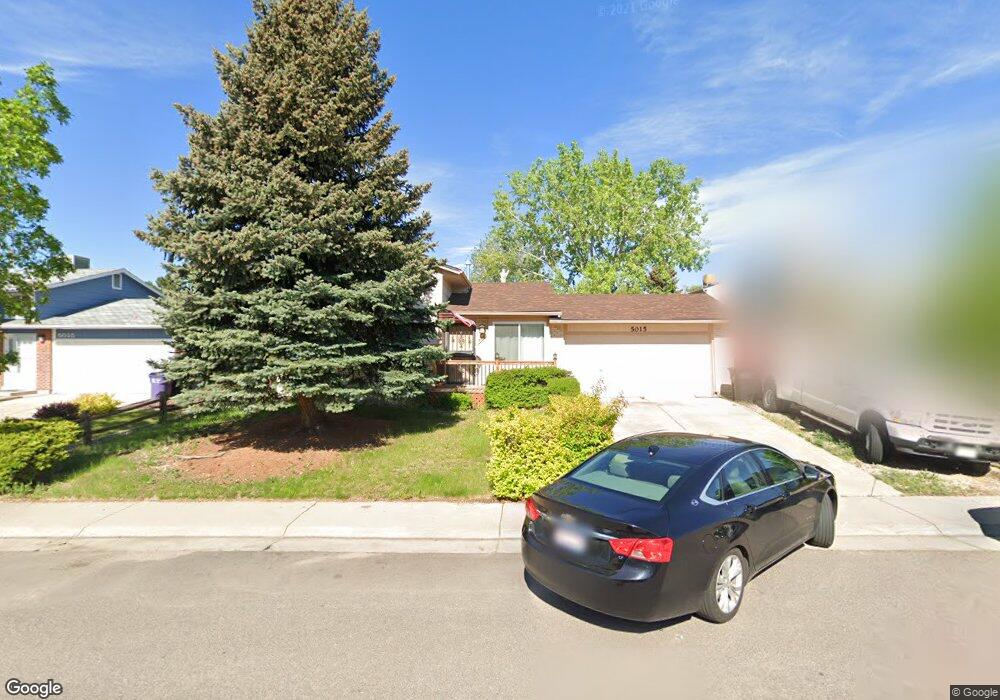
5015 S Independence Way Littleton, CO 80123
Marston NeighborhoodEstimated Value: $526,351 - $578,000
4
Beds
2
Baths
898
Sq Ft
$608/Sq Ft
Est. Value
About This Home
This home is located at 5015 S Independence Way, Littleton, CO 80123 and is currently estimated at $545,588, approximately $607 per square foot. 5015 S Independence Way is a home located in Denver County with nearby schools including Grant Ranch School, John F Kennedy High School, and Montessori Peaks Academy.
Ownership History
Date
Name
Owned For
Owner Type
Purchase Details
Closed on
Mar 5, 1999
Sold by
Tarwater Daniel D R
Bought by
Cordova Efrain and Cordova Rochelle
Current Estimated Value
Home Financials for this Owner
Home Financials are based on the most recent Mortgage that was taken out on this home.
Original Mortgage
$140,440
Outstanding Balance
$34,135
Interest Rate
6.8%
Mortgage Type
FHA
Estimated Equity
$511,453
Purchase Details
Closed on
Nov 30, 1993
Sold by
Rael Brenda J
Bought by
Tarwater Daniel D and Tarwater Christine R
Home Financials for this Owner
Home Financials are based on the most recent Mortgage that was taken out on this home.
Original Mortgage
$106,050
Interest Rate
6.86%
Mortgage Type
Assumption
Purchase Details
Closed on
Sep 27, 1993
Sold by
Rael Joseph M
Bought by
Rael Brenda J
Create a Home Valuation Report for This Property
The Home Valuation Report is an in-depth analysis detailing your home's value as well as a comparison with similar homes in the area
Home Values in the Area
Average Home Value in this Area
Purchase History
| Date | Buyer | Sale Price | Title Company |
|---|---|---|---|
| Cordova Efrain | $145,000 | -- | |
| Tarwater Daniel D | $104,000 | Commonwealth Land Title | |
| Rael Brenda J | -- | -- |
Source: Public Records
Mortgage History
| Date | Status | Borrower | Loan Amount |
|---|---|---|---|
| Open | Cordova Efrain | $140,440 | |
| Previous Owner | Tarwater Daniel D | $106,050 |
Source: Public Records
Tax History Compared to Growth
Tax History
| Year | Tax Paid | Tax Assessment Tax Assessment Total Assessment is a certain percentage of the fair market value that is determined by local assessors to be the total taxable value of land and additions on the property. | Land | Improvement |
|---|---|---|---|---|
| 2024 | $2,557 | $32,280 | $1,060 | $31,220 |
| 2023 | $2,501 | $32,280 | $1,060 | $31,220 |
| 2022 | $2,103 | $26,440 | $4,920 | $21,520 |
| 2021 | $2,030 | $27,200 | $5,060 | $22,140 |
| 2020 | $1,859 | $25,050 | $5,060 | $19,990 |
| 2019 | $1,807 | $25,050 | $5,060 | $19,990 |
| 2018 | $1,622 | $20,970 | $4,640 | $16,330 |
| 2017 | $1,618 | $20,970 | $4,640 | $16,330 |
| 2016 | $1,481 | $18,160 | $4,617 | $13,543 |
| 2015 | $1,419 | $18,160 | $4,617 | $13,543 |
| 2014 | $1,062 | $12,790 | $3,980 | $8,810 |
Source: Public Records
Map
Nearby Homes
- 4934 S Flower Way
- 4962 S Field Ct
- 9975 W Wagon Trail Dr
- 4644 S Kipling Cir
- 9950 W Progress Place
- 5264 S Jellison St
- 10250 W Saratoga Place
- 4644 S Garland Way
- 4869 S Dudley St
- 9614 W Arlington Ave
- 5310 S Jellison St
- 4899 S Dudley St Unit E1
- 4899 S Dudley St Unit 11A
- 4899 S Dudley St Unit 2
- 4899 S Dudley St Unit 4H
- 4899 S Dudley St Unit 14F
- 4899 S Dudley St Unit 7
- 4899 S Dudley St Unit 15B
- 4896 S Dudley St Unit 9-10
- 4896 S Dudley St Unit 8-2
- 5025 S Independence Way
- 5005 S Independence Way
- 9624 W Grand Ave
- 5029 S Independence Way
- 5024 S Independence Way
- 5010 S Independence Ct
- 5028 S Independence Way
- 5014 S Independence Way
- 5020 S Independence Ct
- 9644 W Grand Ave
- 5034 S Independence Way
- 5004 S Independence Way
- 5035 S Independence Way
- 4985 S Independence Way
- 5001 S Independence Ct
- 5038 S Independence Way
- 5030 S Independence Ct
- 5003 S Hoyt St
- 5013 S Hoyt St
- 5023 S Hoyt St