Estimated Value: $201,053 - $253,000
Studio
1
Bath
1,592
Sq Ft
$146/Sq Ft
Est. Value
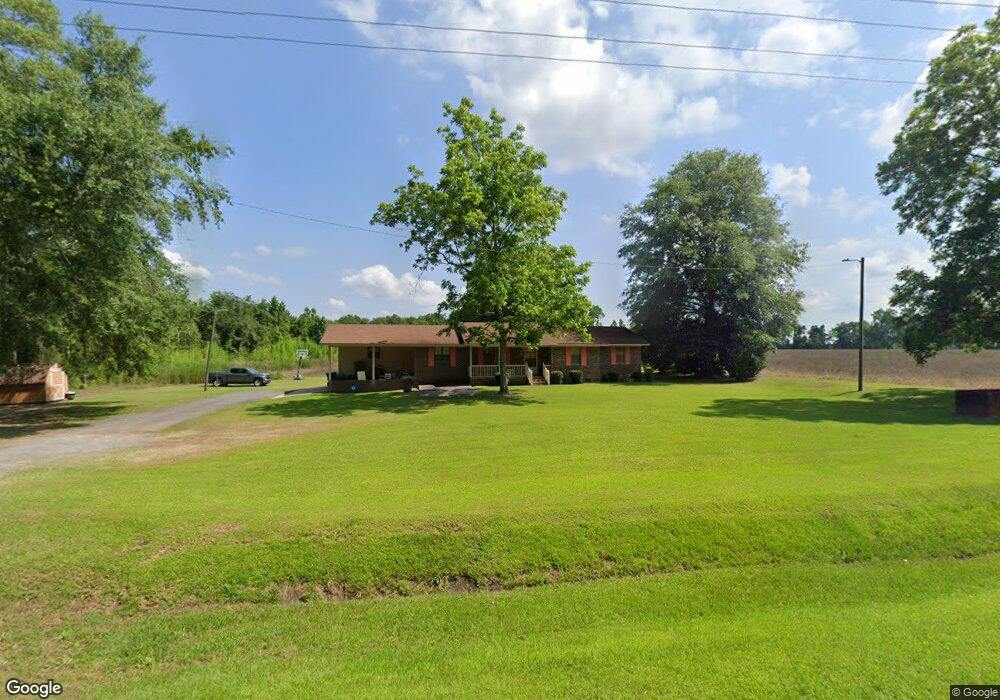
About This Home
This home is located at 5017 Dry Lake Rd, Dixie, GA 31629 and is currently estimated at $231,684, approximately $145 per square foot. 5017 Dry Lake Rd is a home located in Brooks County with nearby schools including Quitman Elementary School.
Ownership History
Date
Name
Owned For
Owner Type
Purchase Details
Closed on
Apr 12, 2021
Sold by
Frazier Dorothy
Bought by
Dorothy Frazier
Current Estimated Value
Purchase Details
Closed on
Dec 15, 2017
Sold by
Frazier Dorothy
Bought by
Frazier Dorothy and Frazier Frank Reynard
Purchase Details
Closed on
Aug 17, 2015
Sold by
Frazier Dorothy Arthur
Bought by
Arthur Jimmie Lee and Christian Tamese Nicole
Purchase Details
Closed on
Mar 17, 2010
Sold by
Frazier Frank
Bought by
Frazier Dorothy
Purchase Details
Closed on
Jan 26, 2010
Sold by
Frazier Frank
Bought by
Frazier Dorothy
Purchase Details
Closed on
Aug 17, 2009
Sold by
Vinson Tonya
Bought by
Frazier Dorothy
Purchase Details
Closed on
Nov 8, 1982
Bought by
Frazier Frank G and Frazier Dorothy R
Purchase Details
Closed on
Aug 18, 1981
Sold by
A-1 Constructon Co Inc
Bought by
Frazier Frank G and Frazier Dorothy R
Purchase Details
Closed on
Apr 23, 1981
Sold by
Frazier Rosa Lee and Frank Grant
Bought by
A-1 Constructon Co Inc
Create a Home Valuation Report for This Property
The Home Valuation Report is an in-depth analysis detailing your home's value as well as a comparison with similar homes in the area
Purchase History
| Date | Buyer | Sale Price | Title Company |
|---|---|---|---|
| Dorothy Frazier | -- | -- | |
| Frazier Dorothy | -- | -- | |
| Arthur Jimmie Lee | -- | -- | |
| Frazier Dorothy | -- | -- | |
| Frazier Dorothy | -- | -- | |
| Frazier Dorothy | -- | -- | |
| Frazier Frank G | -- | -- | |
| Frazier Frank G | $34,000 | -- | |
| A-1 Constructon Co Inc | -- | -- |
Source: Public Records
Tax History
| Year | Tax Paid | Tax Assessment Tax Assessment Total Assessment is a certain percentage of the fair market value that is determined by local assessors to be the total taxable value of land and additions on the property. | Land | Improvement |
|---|---|---|---|---|
| 2025 | $1,850 | $66,040 | $11,880 | $54,160 |
| 2024 | $1,850 | $66,040 | $11,880 | $54,160 |
| 2023 | $1,306 | $62,652 | $11,920 | $50,732 |
| 2022 | $1,564 | $50,460 | $11,320 | $39,140 |
| 2021 | $1,350 | $44,424 | $11,120 | $33,304 |
| 2020 | $1,231 | $44,312 | $11,120 | $33,192 |
| 2019 | $1,250 | $42,140 | $11,320 | $30,820 |
| 2018 | $1,225 | $41,940 | $10,600 | $31,340 |
| 2017 | $1,177 | $40,220 | $10,600 | $29,620 |
| 2016 | $1,222 | $40,660 | $10,600 | $30,060 |
| 2015 | -- | $40,380 | $10,600 | $29,780 |
| 2014 | -- | $33,460 | $3,200 | $30,260 |
| 2013 | -- | $33,460 | $3,200 | $30,260 |
Source: Public Records
Map
Nearby Homes
- 5199 U S 84
- Dixie Rd
- 431 Dry Lake Rd
- 9900 Ozell Rd
- 2156 County Road 78
- 103 Magnolia Dr
- 800 Clifford St
- 1001 W Bartow St
- 4265 Howard Rd
- 804 Westlake Dr
- 304 W Rountree St
- 1038-BA Church St
- 103 Victorian Way
- 807 N Court St
- 606 N Court St
- 621 N Court St
- 203 W Gordon St
- 7402 Coffee Rd
- 714 Morris Ave
- 506 Oglesby St
- 5020 Dry Lake Rd
- 4889 Dry Lake Rd
- 5146 Dry Lake Rd
- 4873 Dry Lake Rd
- 5161 Dry Lake Rd
- 4829 Dry Lake Rd
- 5285 Dry Lake Rd
- 130 Hodges Rd
- 5781 Dry Lake Rd
- 27 Hodges Rd
- 4464 Dry Lake Rd
- 380 Scott Ln
- 0 Dry Lake Rd
- 528 Hodges Rd
- 200 Scott Ln
- 6077 Dry Lake Rd
- 5558 Dry Lake Rd
- 4380 Dry Lake Rd
- 4376 Dry Lake Rd
- 2595 Simmon Hill Rd
Your Personal Tour Guide
Ask me questions while you tour the home.