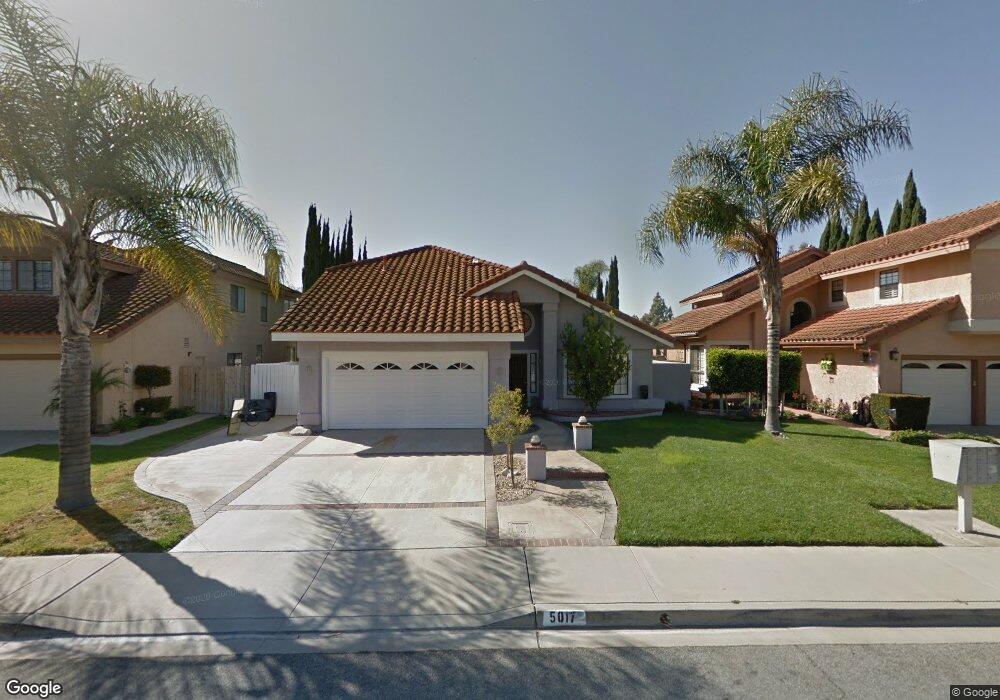
5017 Via Cupertino Camarillo, CA 93012
Estimated Value: $968,421 - $1,065,000
3
Beds
3
Baths
1,824
Sq Ft
$555/Sq Ft
Est. Value
About This Home
This home is located at 5017 Via Cupertino, Camarillo, CA 93012 and is currently estimated at $1,012,855, approximately $555 per square foot. 5017 Via Cupertino is a home located in Ventura County with nearby schools including Tierra Linda Elementary School, Las Colinas Middle School, and Adolfo Camarillo High School.
Ownership History
Date
Name
Owned For
Owner Type
Purchase Details
Closed on
Jun 18, 2020
Sold by
Hansen Hanne and The 1996 Hanne Hansen Family T
Bought by
Hansen Hanne L and The 1996 Hanne Hansen Family T
Current Estimated Value
Purchase Details
Closed on
Jul 22, 2006
Sold by
Hansen Hanne
Bought by
Hansen Hanne
Purchase Details
Closed on
Jun 18, 2001
Sold by
Rigonan Nestor M and Rigonan Corvelita S
Bought by
Hansen Hanne
Home Financials for this Owner
Home Financials are based on the most recent Mortgage that was taken out on this home.
Original Mortgage
$300,000
Interest Rate
7.21%
Purchase Details
Closed on
Jun 3, 1999
Sold by
Rigonan Nestor M Corvelita S
Bought by
Rigonan Nestor M and Rigonan Corvelita S
Create a Home Valuation Report for This Property
The Home Valuation Report is an in-depth analysis detailing your home's value as well as a comparison with similar homes in the area
Home Values in the Area
Average Home Value in this Area
Purchase History
| Date | Buyer | Sale Price | Title Company |
|---|---|---|---|
| Hansen Hanne L | -- | Consumers Title Co Of Ca Inc | |
| Hansen Hanne | -- | None Available | |
| Hansen Hanne | $380,000 | Equity Title | |
| Rigonan Nestor M | -- | -- |
Source: Public Records
Mortgage History
| Date | Status | Borrower | Loan Amount |
|---|---|---|---|
| Previous Owner | Hansen Hanne | $300,000 |
Source: Public Records
Tax History Compared to Growth
Tax History
| Year | Tax Paid | Tax Assessment Tax Assessment Total Assessment is a certain percentage of the fair market value that is determined by local assessors to be the total taxable value of land and additions on the property. | Land | Improvement |
|---|---|---|---|---|
| 2025 | $6,488 | $596,888 | $224,535 | $372,353 |
| 2024 | $6,488 | $585,185 | $220,133 | $365,052 |
| 2023 | $6,254 | $573,711 | $215,816 | $357,895 |
| 2022 | $6,234 | $562,462 | $211,584 | $350,878 |
| 2021 | $6,009 | $551,434 | $207,435 | $343,999 |
| 2020 | $5,986 | $545,782 | $205,309 | $340,473 |
| 2019 | $5,958 | $535,082 | $201,284 | $333,798 |
| 2018 | $5,847 | $524,591 | $197,338 | $327,253 |
| 2017 | $5,502 | $514,306 | $193,469 | $320,837 |
| 2016 | $5,369 | $504,223 | $189,676 | $314,547 |
| 2015 | $5,312 | $496,651 | $186,828 | $309,823 |
| 2014 | $5,187 | $486,924 | $183,169 | $303,755 |
Source: Public Records
Map
Nearby Homes
- 860 Laurel Park Cir
- 676 Buenos Tiempos Dr
- 5247 San Francesca Dr
- 5302 Paseo Ricoso
- 5004 Ladera Vista Dr
- 1253 Mission Verde Dr Unit 1142
- 14 Tahquitz Ct Unit 213
- 18 Tahquitz Ct Unit 217
- 135 Tranquila Dr Unit 61
- 1404 Calle Lozano
- 1216 Mission Verde Dr
- 232 Talud Terrace Unit 19
- 2854 Via Descanso
- 2860 Via Descanso
- 790 Vista Palacio
- 369 Estancia Place
- 5118 Village 5
- 1631 Alta Vista Place
- 353 Via Cantilena Unit 87
- 7202 Village 7 Unit 7
- 5005 Via Cupertino
- 5029 Via Cupertino
- 4991 Via Cupertino
- 5035 Via Cupertino
- 4932 Paseo Montelena
- 4920 Paseo Montelena
- 4942 Paseo Montelena
- 4912 Paseo Montelena
- 4979 Via Cupertino
- 5047 Via Cupertino
- 4954 Paseo Montelena
- 5028 Via Cupertino
- 5016 Via Cupertino
- 4904 Paseo Montelena
- 5034 Via Cupertino
- 5004 Via Cupertino
- 4960 Paseo Montelena
- 5059 Via Cupertino
- 4967 Via Cupertino
- 5046 Via Cupertino