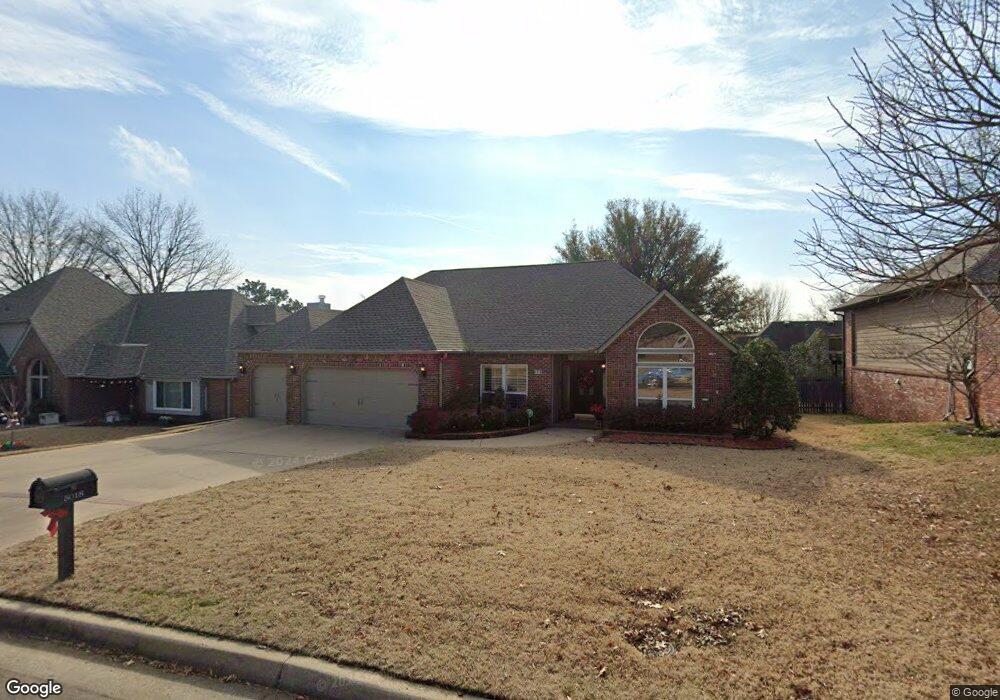
5018 E 88th St Tulsa, OK 74137
Brookwood NeighborhoodEstimated Value: $336,533 - $431,000
3
Beds
2
Baths
2,299
Sq Ft
$167/Sq Ft
Est. Value
About This Home
This home is located at 5018 E 88th St, Tulsa, OK 74137 and is currently estimated at $384,383, approximately $167 per square foot. 5018 E 88th St is a home located in Tulsa County with nearby schools including Darnaby Elementary School, Union 8th Grade Center, and Union 6th-7th Grade Center.
Ownership History
Date
Name
Owned For
Owner Type
Purchase Details
Closed on
Apr 26, 2022
Sold by
Boucher Kevin W
Bought by
Boucher Stephanie A
Current Estimated Value
Purchase Details
Closed on
Jun 17, 2011
Sold by
Neel Jerre Catherine and Neel Raymond Clifford
Bought by
Boucher Kevin W and Boucher Stephanie A
Purchase Details
Closed on
Aug 16, 2006
Sold by
Neel Raymond Clifford and Neel Jerre Catherine
Bought by
Neel Jerre Catherine and Neel Raymond Clifford
Purchase Details
Closed on
Apr 21, 2006
Sold by
Reum Rex and Reum Paula C
Bought by
Boyls Kathleen A
Purchase Details
Closed on
Mar 26, 2004
Sold by
Kuntz Katharine G
Bought by
Reum Rex and Reum Paula C
Purchase Details
Closed on
Nov 19, 2003
Sold by
Root Donna J
Bought by
Kuntz Katharine G and The Katharine G Kuntz Trust
Purchase Details
Closed on
Apr 1, 1990
Create a Home Valuation Report for This Property
The Home Valuation Report is an in-depth analysis detailing your home's value as well as a comparison with similar homes in the area
Home Values in the Area
Average Home Value in this Area
Purchase History
| Date | Buyer | Sale Price | Title Company |
|---|---|---|---|
| Boucher Stephanie A | -- | None Listed On Document | |
| Boucher Kevin W | $223,000 | None Available | |
| Neel Jerre Catherine | -- | None Available | |
| Boyls Kathleen A | $258,000 | The Executives Title & Escro | |
| Reum Rex | $269,000 | The Executives Title & Escro | |
| Kuntz Katharine G | $242,000 | The Executives Title & Escro | |
| -- | $37,000 | -- |
Source: Public Records
Tax History
| Year | Tax Paid | Tax Assessment Tax Assessment Total Assessment is a certain percentage of the fair market value that is determined by local assessors to be the total taxable value of land and additions on the property. | Land | Improvement |
|---|---|---|---|---|
| 2025 | $3,638 | $26,608 | $4,070 | $22,538 |
| 2024 | $3,200 | $25,805 | $4,058 | $21,747 |
| 2023 | $3,200 | $26,024 | $4,572 | $21,452 |
| 2022 | $3,233 | $24,266 | $5,267 | $18,999 |
| 2021 | $3,175 | $23,530 | $5,107 | $18,423 |
| 2020 | $3,129 | $23,530 | $5,107 | $18,423 |
| 2019 | $3,239 | $23,530 | $5,107 | $18,423 |
| 2018 | $3,232 | $23,530 | $5,107 | $18,423 |
| 2017 | $3,251 | $24,530 | $5,324 | $19,206 |
| 2016 | $3,179 | $24,530 | $5,324 | $19,206 |
| 2015 | $3,213 | $24,530 | $5,324 | $19,206 |
| 2014 | $3,163 | $24,530 | $5,324 | $19,206 |
Source: Public Records
Map
Nearby Homes
- 5009 E 86th Place
- 5132 E 85th St
- 5220 E 88th St
- 4517 E 85th St
- 8505 S Toledo Ave
- 4335 E 87th St
- 8321 S Sandusky Ave
- 4217 E 84th Place
- 4607 E 93rd Ct Unit 18
- 8239 S Toledo Ave
- 4608 E 93rd Ct Unit 19
- 8242 S Sandusky Ave
- 4616 E 93rd Ct Unit C
- 5129 E 80th St
- 9021 S Maplewood Ave
- 6109 E 91st Place
- 4418 E 93rd Place S
- 7951 S Hudson Place
- 5417 E 80th St
- 0 E 85th Ct Unit 2527614
- 5022 E 88th St
- 5014 E 88th St
- 4925 E 88th Place
- 5104 E 88th St
- 4929 E 88th Place
- 4921 E 88th Place
- 5010 E 88th St
- 8640 S Braden Ave
- 4917 E 88th Place
- 4933 E 88th Place
- 5011 E 88th St
- 5108 E 88th St
- 5006 E 88th St
- 8641 S Braden Ave
- 8636 S Braden Ave
- 5015 E 88th St
- 5016 E 88th St
- 5025 E 88th St
- 4937 E 88th Place
- 4913 E 88th Place
Your Personal Tour Guide
Ask me questions while you tour the home.