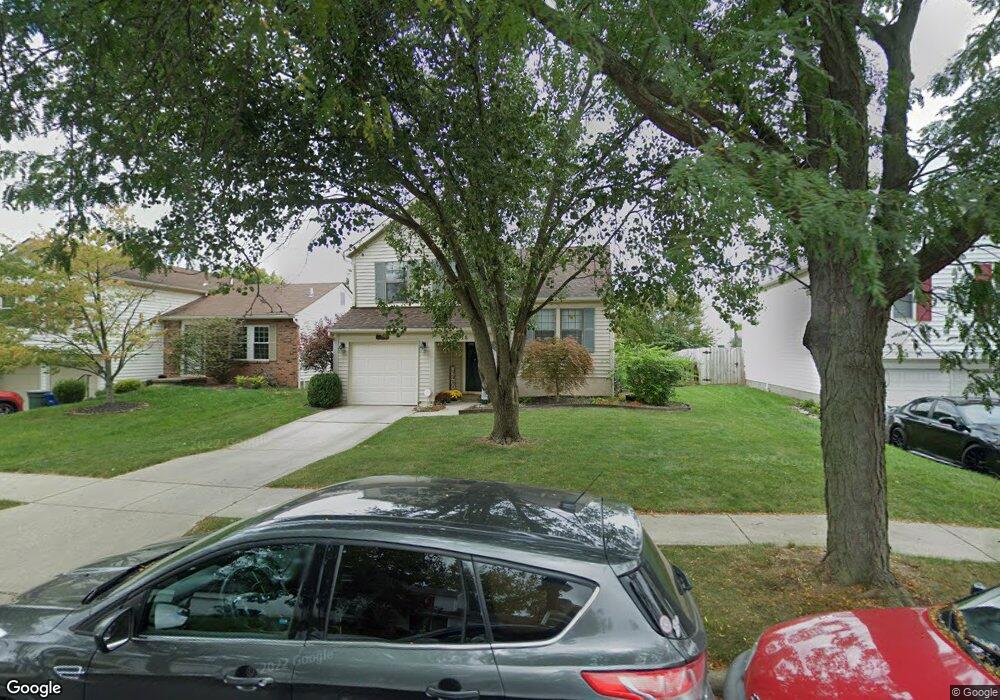
5018 Hidden View Dr Hilliard, OH 43026
Cross Creek NeighborhoodEstimated Value: $340,050 - $362,000
3
Beds
2
Baths
1,308
Sq Ft
$270/Sq Ft
Est. Value
About This Home
This home is located at 5018 Hidden View Dr, Hilliard, OH 43026 and is currently estimated at $353,013, approximately $269 per square foot. 5018 Hidden View Dr is a home located in Franklin County with nearby schools including J W Reason Elementary School, Hilliard Station Sixth Grade Elementary School, and Hilliard Heritage Middle School.
Ownership History
Date
Name
Owned For
Owner Type
Purchase Details
Closed on
Aug 22, 2003
Sold by
Humphrey Christopher M and Humphrey Kristina K
Bought by
Rex Craig M and Rex Leanne K
Current Estimated Value
Home Financials for this Owner
Home Financials are based on the most recent Mortgage that was taken out on this home.
Original Mortgage
$139,398
Outstanding Balance
$62,946
Interest Rate
5.97%
Mortgage Type
FHA
Estimated Equity
$290,067
Purchase Details
Closed on
May 31, 2001
Sold by
Tracy Larry A and Tracy Deborah A
Bought by
Humphrey Christopher M and Humphrey Kristina K
Home Financials for this Owner
Home Financials are based on the most recent Mortgage that was taken out on this home.
Original Mortgage
$122,510
Interest Rate
7.23%
Mortgage Type
FHA
Purchase Details
Closed on
May 18, 1998
Sold by
Whitis John R and Whitis Stacey A
Bought by
Tracy Larry A and Tracy Deborah A
Purchase Details
Closed on
Aug 24, 1993
Purchase Details
Closed on
May 25, 1993
Create a Home Valuation Report for This Property
The Home Valuation Report is an in-depth analysis detailing your home's value as well as a comparison with similar homes in the area
Home Values in the Area
Average Home Value in this Area
Purchase History
| Date | Buyer | Sale Price | Title Company |
|---|---|---|---|
| Rex Craig M | $140,500 | Chicago Title | |
| Humphrey Christopher M | $123,900 | Chicago Title | |
| Tracy Larry A | $108,500 | -- | |
| -- | -- | -- | |
| -- | $92,500 | -- |
Source: Public Records
Mortgage History
| Date | Status | Borrower | Loan Amount |
|---|---|---|---|
| Open | Rex Craig M | $139,398 | |
| Closed | Humphrey Christopher M | $122,510 |
Source: Public Records
Tax History Compared to Growth
Tax History
| Year | Tax Paid | Tax Assessment Tax Assessment Total Assessment is a certain percentage of the fair market value that is determined by local assessors to be the total taxable value of land and additions on the property. | Land | Improvement |
|---|---|---|---|---|
| 2024 | $4,988 | $88,310 | $30,000 | $58,310 |
| 2023 | $4,321 | $88,305 | $29,995 | $58,310 |
| 2022 | $3,820 | $62,510 | $12,600 | $49,910 |
| 2021 | $3,816 | $62,510 | $12,600 | $49,910 |
| 2020 | $3,805 | $62,510 | $12,600 | $49,910 |
| 2019 | $3,498 | $49,070 | $10,080 | $38,990 |
| 2018 | $3,373 | $49,070 | $10,080 | $38,990 |
| 2017 | $3,483 | $49,070 | $10,080 | $38,990 |
| 2016 | $3,480 | $45,400 | $11,660 | $33,740 |
| 2015 | $3,261 | $45,400 | $11,660 | $33,740 |
| 2014 | $3,267 | $45,400 | $11,660 | $33,740 |
| 2013 | $1,635 | $44,835 | $11,095 | $33,740 |
Source: Public Records
Map
Nearby Homes
- 4976 Shady Oak Dr
- 5052 Bressler Dr
- 2756 Shelton Cir
- 2759 Lyndley Ct
- 4995 Singleton Dr
- 4995 Singleton Dr Unit 18c
- 5112 Bressler Dr
- 4945 Singleton Dr Unit 13C
- 5188 Calhoon Ct
- 5215 Bressler Dr
- 5258 Skytrail Dr
- 2967 Castlebrook Ave
- 2477 Crystal Springs Dr
- 3012 Papin St Unit 39
- 5285 Redlands Dr
- 2401 Featherwood Dr
- 3003 Parker Ln
- 3111 Castlebrook Ave
- 4969 Hilliard Green Dr
- 2321 Shelby Ln
- 5010 Hidden View Dr
- 5026 Hidden View Dr
- 5034 Hidden View Dr
- 5000 Hidden View Dr
- 5023 Shady Oak Dr
- 5017 Shady Oak Dr
- 5029 Shady Oak Dr
- 5037 Shady Oak Dr
- 5005 Shady Oak Dr
- 5025 Hidden View Dr
- 5019 Hidden View Dr
- 5043 Shady Oak Dr
- 5011 Hidden View Dr
- 5039 Hidden View Dr
- 5049 Shady Oak Dr
- 5047 Hidden View Dr
- 4999 Hidden View Ct
- 5056 Hidden View Dr
- 2682 Ashlynn Ln
- 2676 Ashlynn Ln