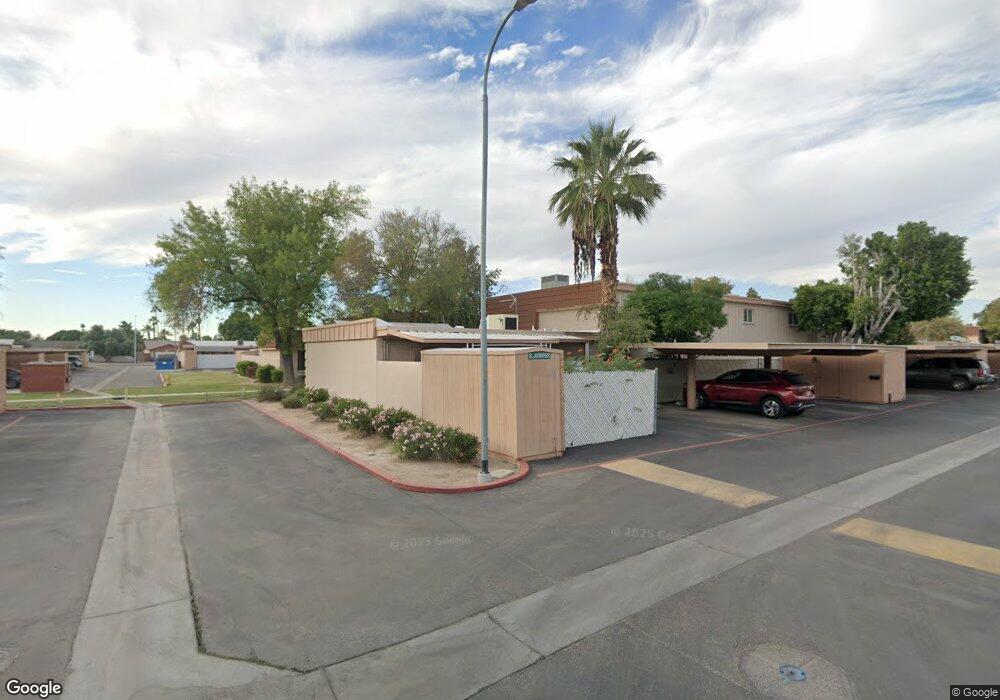
5018 S Juniper St Tempe, AZ 85282
The Lakes NeighborhoodEstimated Value: $287,243 - $345,000
2
Beds
2
Baths
1,320
Sq Ft
$236/Sq Ft
Est. Value
About This Home
This home is located at 5018 S Juniper St, Tempe, AZ 85282 and is currently estimated at $311,061, approximately $235 per square foot. 5018 S Juniper St is a home located in Maricopa County with nearby schools including Arredondo Elementary School, Connolly Middle School, and McClintock High School.
Ownership History
Date
Name
Owned For
Owner Type
Purchase Details
Closed on
Jun 16, 2011
Sold by
Chavez Steven M
Bought by
Fox Brenda J
Current Estimated Value
Home Financials for this Owner
Home Financials are based on the most recent Mortgage that was taken out on this home.
Original Mortgage
$68,176
Outstanding Balance
$47,525
Interest Rate
4.87%
Mortgage Type
FHA
Estimated Equity
$263,536
Purchase Details
Closed on
Aug 21, 2006
Sold by
Bolan Jeffrey R
Bought by
Chavez Steven M
Home Financials for this Owner
Home Financials are based on the most recent Mortgage that was taken out on this home.
Original Mortgage
$204,000
Interest Rate
6.76%
Mortgage Type
Purchase Money Mortgage
Purchase Details
Closed on
Feb 6, 1996
Sold by
Tyley Lucille M
Bought by
Bolan Jeffrey R
Home Financials for this Owner
Home Financials are based on the most recent Mortgage that was taken out on this home.
Original Mortgage
$61,707
Interest Rate
7.1%
Mortgage Type
FHA
Create a Home Valuation Report for This Property
The Home Valuation Report is an in-depth analysis detailing your home's value as well as a comparison with similar homes in the area
Home Values in the Area
Average Home Value in this Area
Purchase History
| Date | Buyer | Sale Price | Title Company |
|---|---|---|---|
| Fox Brenda J | $69,950 | Equity Title Agency Inc | |
| Chavez Steven M | $204,000 | Title Guaranty Agency Of Az | |
| Bolan Jeffrey R | $62,500 | First American Title |
Source: Public Records
Mortgage History
| Date | Status | Borrower | Loan Amount |
|---|---|---|---|
| Open | Fox Brenda J | $68,176 | |
| Previous Owner | Chavez Steven M | $204,000 | |
| Previous Owner | Bolan Jeffrey R | $61,707 |
Source: Public Records
Tax History
| Year | Tax Paid | Tax Assessment Tax Assessment Total Assessment is a certain percentage of the fair market value that is determined by local assessors to be the total taxable value of land and additions on the property. | Land | Improvement |
|---|---|---|---|---|
| 2025 | $1,177 | $11,288 | -- | -- |
| 2024 | $1,080 | $10,751 | -- | -- |
| 2023 | $1,080 | $22,160 | $4,430 | $17,730 |
| 2022 | $1,031 | $17,570 | $3,510 | $14,060 |
| 2021 | $1,052 | $16,180 | $3,230 | $12,950 |
| 2020 | $1,017 | $14,970 | $2,990 | $11,980 |
| 2019 | $997 | $12,780 | $2,550 | $10,230 |
| 2018 | $970 | $11,620 | $2,320 | $9,300 |
| 2017 | $940 | $10,310 | $2,060 | $8,250 |
| 2016 | $936 | $9,570 | $1,910 | $7,660 |
| 2015 | $905 | $8,530 | $1,700 | $6,830 |
Source: Public Records
Map
Nearby Homes
- 5011 S Birch St
- 4815 S Birch St
- 4811 S Birch St
- 5014 S Elm St
- 1638 E Donner Dr
- 1623 E Baker Dr
- 4804 S Elm St
- 1506 E Northshore Dr
- 1813 E Ellis Dr
- 1546 E Windjammer Way
- 1331 E Northshore Dr
- 1508 E Weathervane Ln
- 1228 E Fremont Dr
- 1232 E Baseline Rd
- 1209 E Northshore Dr Unit 142
- 1209 E Northshore Dr Unit 138
- 1500 E Edgewater Dr
- 1210 E Harbor View Dr
- 1518 E Candlestick Dr
- 1203 E Northshore Dr Unit 130
- 5014 S Juniper St
- 5012 S Juniper St
- 5010 S Juniper St
- 1608 E Dunbar Dr
- 5009 S Birch St
- 5008 S Juniper St
- 1605 E Dunbar Dr
- 1601 E Dunbar Dr
- 1603 E Dunbar Dr
- 1607 E Dunbar Dr
- 5007 S Birch St
- 1612 E Dunbar Dr
- 5006 S Juniper St
- 5005 S Birch St
- 1609 E Dunbar Dr
- 1614 E Dunbar Dr
- 5003 S Birch St
- 1611 E Dunbar Dr
- 1605 E Ellis Dr
- 5004 S Juniper St
Your Personal Tour Guide
Ask me questions while you tour the home.