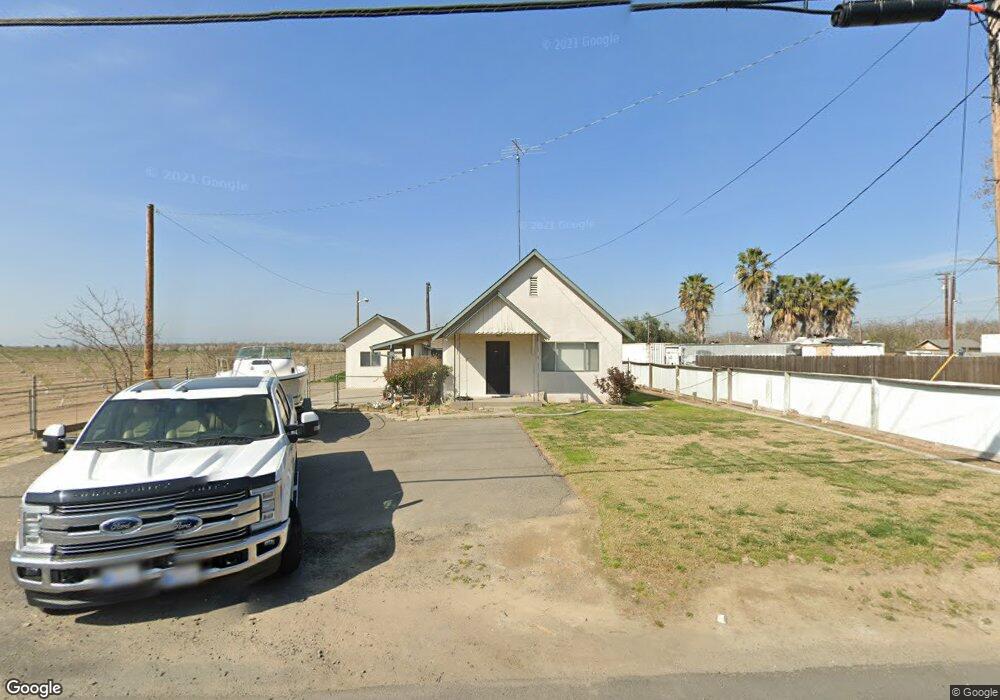
5019 Crows Landing Rd Modesto, CA 95358
Estimated Value: $283,969 - $444,000
2
Beds
1
Bath
864
Sq Ft
$395/Sq Ft
Est. Value
About This Home
This home is located at 5019 Crows Landing Rd, Modesto, CA 95358 and is currently estimated at $340,990, approximately $394 per square foot. 5019 Crows Landing Rd is a home located in Stanislaus County with nearby schools including Westport Elementary School, Blaker-Kinser Junior High School, and Central Valley High School.
Ownership History
Date
Name
Owned For
Owner Type
Purchase Details
Closed on
Jul 18, 2019
Sold by
Sousa Robert B and Sousa Kandis Jean
Bought by
Jkl Orchards Llc
Current Estimated Value
Purchase Details
Closed on
Mar 24, 2006
Sold by
Garber M Lynn
Bought by
Sousa Sevie and Sousa Dolores
Home Financials for this Owner
Home Financials are based on the most recent Mortgage that was taken out on this home.
Original Mortgage
$200,000
Interest Rate
6.2%
Mortgage Type
Credit Line Revolving
Purchase Details
Closed on
Aug 20, 2004
Sold by
Sousa Sevie and Sousa Dolores
Bought by
Sousa Robert B and Sousa Kandi Jean
Home Financials for this Owner
Home Financials are based on the most recent Mortgage that was taken out on this home.
Original Mortgage
$435,000
Interest Rate
5.95%
Mortgage Type
Seller Take Back
Purchase Details
Closed on
Oct 27, 2000
Sold by
Baker Laverne Sousa
Bought by
Sousa Sevie and Sousa Dolores
Create a Home Valuation Report for This Property
The Home Valuation Report is an in-depth analysis detailing your home's value as well as a comparison with similar homes in the area
Purchase History
| Date | Buyer | Sale Price | Title Company |
|---|---|---|---|
| Jkl Orchards Llc | $1,550,000 | North American Title Company | |
| Sousa Sevie | -- | Alliance Title Company | |
| Sousa Robert B | $435,000 | Alliance Title Company | |
| Sousa Sevie | $217,500 | First American Title Ins Co |
Source: Public Records
Mortgage History
| Date | Status | Borrower | Loan Amount |
|---|---|---|---|
| Previous Owner | Sousa Sevie | $200,000 | |
| Previous Owner | Sousa Robert B | $435,000 |
Source: Public Records
Tax History
| Year | Tax Paid | Tax Assessment Tax Assessment Total Assessment is a certain percentage of the fair market value that is determined by local assessors to be the total taxable value of land and additions on the property. | Land | Improvement |
|---|---|---|---|---|
| 2025 | $740 | $50,877 | $8,074 | $42,803 |
| 2024 | $703 | $49,880 | $7,916 | $41,964 |
| 2023 | $683 | $48,903 | $7,761 | $41,142 |
| 2022 | $653 | $47,945 | $7,609 | $40,336 |
| 2021 | $648 | $47,006 | $7,460 | $39,546 |
| 2020 | $632 | $46,525 | $7,384 | $39,141 |
| 2019 | $550 | $45,614 | $7,240 | $38,374 |
| 2018 | $540 | $44,721 | $7,099 | $37,622 |
| 2017 | $535 | $43,845 | $6,960 | $36,885 |
| 2016 | $444 | $42,986 | $6,824 | $36,162 |
| 2015 | $436 | $42,341 | $6,722 | $35,619 |
| 2014 | $430 | $41,513 | $6,591 | $34,922 |
Source: Public Records
Map
Nearby Homes
- 5237 Crows Landing Rd
- 1279 Montclaire Dr
- 4396 Admiral Ct
- 4376 Admiral Ct
- 1237 W Keyes Rd
- 3816 Teek Ct
- 3608 Cassie Ln
- 1440 Don Pedro Rd
- 954 Avenida Real
- 0 0 Unit 226038566
- 0 0 Unit 226038593
- 940 Allacante Dr
- 3816 Dano Ct
- 3501 Soda Canyon Dr
- 2030 E Grayson Rd Unit 42
- 2030 E Grayson Rd Unit 44
- 2030 E Grayson Rd Unit 26
- 1628 Sungate Dr
- 815 Starke Dr
- 3116 Larrynell Dr
- 5001 Crows Landing Rd
- 5001 Crowslanding Rd
- 130 W Grayson Rd
- 5012 Crows Landing Rd
- 4955 Crows Landing Rd
- 5107 Crows Landing Rd
- 5000 Crows Landing Rd
- 4866 Crows Landing Rd
- 5 A St
- 5200 Avenue A
- 5207 Avenue A
- 5207 A St
- 224 San Joaquin St
- 5230 Crows Landing Rd
- 501 W Grayson Rd
- 4742 Crows Landing Rd
- 242 San Joaquin St
- 5230 Avenue A
- 5242 Avenue A
- 5201 Avenue B
Your Personal Tour Guide
Ask me questions while you tour the home.