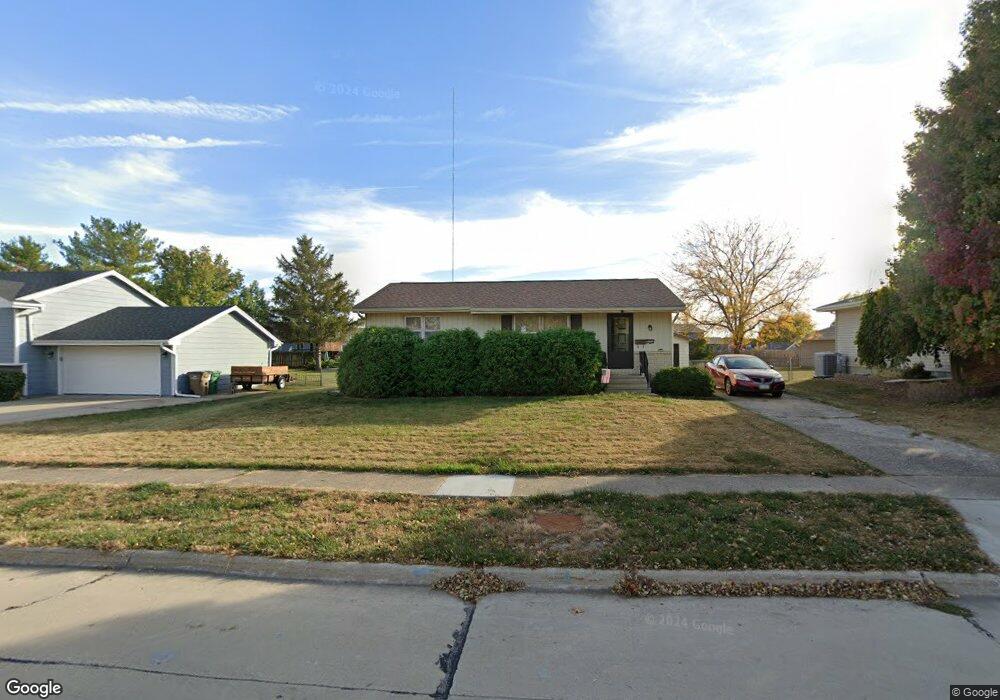
502 15th St SE Altoona, IA 50009
Estimated Value: $230,000 - $243,000
--
Bed
1
Bath
988
Sq Ft
$236/Sq Ft
Est. Value
About This Home
This home is located at 502 15th St SE, Altoona, IA 50009 and is currently estimated at $233,649, approximately $236 per square foot. 502 15th St SE is a home located in Polk County with nearby schools including Centennial Elementary School, Southeast Polk Spring Creek- 6th Grade, and Southeast Polk Junior High School.
Ownership History
Date
Name
Owned For
Owner Type
Purchase Details
Closed on
Mar 6, 2024
Sold by
Lappe Ronald Willard
Bought by
Lappe Ronald Willard and Lappe Ryan R
Current Estimated Value
Purchase Details
Closed on
Mar 8, 2023
Sold by
Brinker Michael J and Brinker Donna C
Bought by
Brinker Michael J and Kluss Donna C
Purchase Details
Closed on
Dec 28, 2022
Sold by
Nelson Anthony J Le
Bought by
Nelson Amy L
Purchase Details
Closed on
Sep 2, 2022
Sold by
Lappe Paulette
Bought by
Lappe Ronald
Purchase Details
Closed on
Mar 2, 2007
Sold by
Adams Properties Inc
Bought by
Cornerstone Homes Ltd
Home Financials for this Owner
Home Financials are based on the most recent Mortgage that was taken out on this home.
Original Mortgage
$170,000
Interest Rate
6.27%
Mortgage Type
Construction
Create a Home Valuation Report for This Property
The Home Valuation Report is an in-depth analysis detailing your home's value as well as a comparison with similar homes in the area
Home Values in the Area
Average Home Value in this Area
Purchase History
| Date | Buyer | Sale Price | Title Company |
|---|---|---|---|
| Lappe Ronald Willard | -- | None Listed On Document | |
| Lappe Ronald Willard | -- | None Listed On Document | |
| Brinker Michael J | -- | -- | |
| Nelson Amy L | -- | None Listed On Document | |
| Nelson Amy L | -- | None Listed On Document | |
| Lappe Ronald | -- | None Listed On Document | |
| Lappe Ronald | -- | None Listed On Document | |
| Cornerstone Homes Ltd | $35,500 | Itc |
Source: Public Records
Mortgage History
| Date | Status | Borrower | Loan Amount |
|---|---|---|---|
| Previous Owner | Cornerstone Homes Ltd | $170,000 |
Source: Public Records
Tax History Compared to Growth
Tax History
| Year | Tax Paid | Tax Assessment Tax Assessment Total Assessment is a certain percentage of the fair market value that is determined by local assessors to be the total taxable value of land and additions on the property. | Land | Improvement |
|---|---|---|---|---|
| 2025 | $2,824 | $205,100 | $57,800 | $147,300 |
| 2024 | $2,824 | $190,100 | $52,800 | $137,300 |
| 2023 | $2,890 | $190,100 | $52,800 | $137,300 |
| 2022 | $2,852 | $153,900 | $44,200 | $109,700 |
| 2021 | $2,758 | $153,900 | $44,200 | $109,700 |
| 2020 | $2,706 | $142,100 | $40,600 | $101,500 |
| 2019 | $2,474 | $142,100 | $40,600 | $101,500 |
| 2018 | $2,472 | $128,400 | $35,300 | $93,100 |
| 2017 | $2,524 | $128,400 | $35,300 | $93,100 |
| 2016 | $2,512 | $119,400 | $32,600 | $86,800 |
| 2015 | $2,512 | $119,400 | $32,600 | $86,800 |
| 2014 | $2,138 | $102,700 | $27,700 | $75,000 |
Source: Public Records
Map
Nearby Homes
- 1411 4th Ave SE
- 526 Sunset Dr SE
- 707 18th St SE
- 3423 5th Ave SE
- 3424 5th Ave SE
- 3418 5th Ave SE
- 3412 5th Ave SE
- 3406 5th Ave SE
- 1206 3rd Ave SE
- 1212 8th Ave SE
- 1905 8th Ave SE
- 1308 9th Avenue Place SE
- 4015 2nd Ave SW
- 4009 2nd Ave SW
- 4016 2nd Ave SW
- 725 11th St SE
- 1113 9th Ave SE
- 2101 4th Ave SE
- 907 7th Ave SE Unit 1
- 909 7th Ave SE Unit 6
- 502 15th St SE
- 406 15th St SE
- 504 15th St SE
- 404 15th St SE
- 506 15th St SE
- 1411 5th Ave SE
- 1410 5th Ave SE
- 523 17th St SE
- 515 17th St SE
- 531 17th St SE
- 402 15th St SE
- 1502 6th Ave SE
- 1409 5th Ave SE
- 1502 6th Ave SE
- 1408 5th Ave SE
- 507 17th St SE
- 507 15th St SE
- 539 17th St SE
- 509 15th St SE
- 509 15th St SE