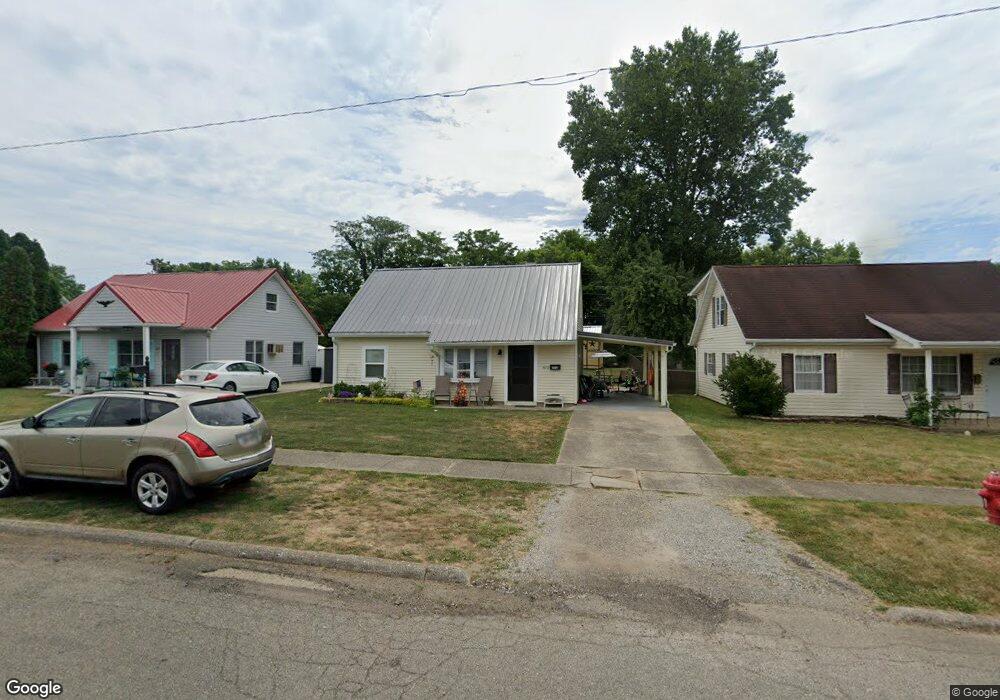
502 E 7th St Waverly, OH 45690
Estimated Value: $129,000 - $193,000
2
Beds
1
Bath
800
Sq Ft
$191/Sq Ft
Est. Value
About This Home
This home is located at 502 E 7th St, Waverly, OH 45690 and is currently estimated at $152,865, approximately $191 per square foot. 502 E 7th St is a home located in Pike County with nearby schools including Waverly Primary School, Waverly Intermediate School, and Waverly Junior High School.
Ownership History
Date
Name
Owned For
Owner Type
Purchase Details
Closed on
May 20, 2019
Sold by
Howard Holdings Ltd
Bought by
Wright James L and Harris Letecia A
Current Estimated Value
Home Financials for this Owner
Home Financials are based on the most recent Mortgage that was taken out on this home.
Original Mortgage
$122,900
Outstanding Balance
$110,125
Interest Rate
4.1%
Mortgage Type
USDA
Estimated Equity
$42,740
Purchase Details
Closed on
Jun 22, 2018
Sold by
Lowery Bruce P
Bought by
Howard Holdings Ltd
Create a Home Valuation Report for This Property
The Home Valuation Report is an in-depth analysis detailing your home's value as well as a comparison with similar homes in the area
Home Values in the Area
Average Home Value in this Area
Purchase History
| Date | Buyer | Sale Price | Title Company |
|---|---|---|---|
| Wright James L | $122,900 | Trident Title Agency | |
| Howard Holdings Ltd | $34,000 | None Available |
Source: Public Records
Mortgage History
| Date | Status | Borrower | Loan Amount |
|---|---|---|---|
| Open | Wright James L | $122,900 |
Source: Public Records
Tax History
| Year | Tax Paid | Tax Assessment Tax Assessment Total Assessment is a certain percentage of the fair market value that is determined by local assessors to be the total taxable value of land and additions on the property. | Land | Improvement |
|---|---|---|---|---|
| 2024 | $801 | $21,230 | $7,440 | $13,790 |
| 2023 | $771 | $21,230 | $7,440 | $13,790 |
| 2022 | $692 | $16,550 | $5,750 | $10,800 |
| 2021 | $679 | $16,550 | $5,750 | $10,800 |
| 2020 | $679 | $16,550 | $5,750 | $10,800 |
| 2019 | $212 | $14,020 | $4,860 | $9,160 |
| 2018 | $7,824 | $14,020 | $4,860 | $9,160 |
| 2017 | $16,602 | $14,020 | $4,860 | $9,160 |
| 2016 | $407 | $18,610 | $4,190 | $14,420 |
| 2015 | $407 | $18,610 | $4,190 | $14,420 |
| 2014 | $394 | $18,610 | $4,190 | $14,420 |
| 2013 | $399 | $18,610 | $4,190 | $14,420 |
| 2012 | $408 | $18,610 | $4,190 | $14,420 |
Source: Public Records
Map
Nearby Homes
Your Personal Tour Guide
Ask me questions while you tour the home.