Estimated Value: $50,971 - $62,000
Studio
--
Bath
664
Sq Ft
$84/Sq Ft
Est. Value
About This Home
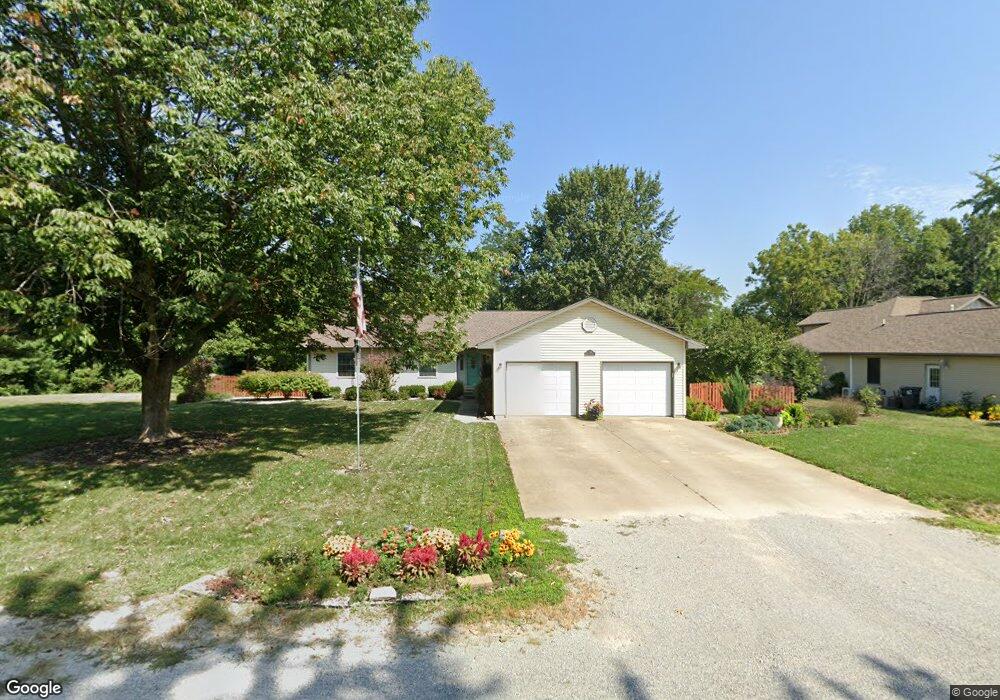
This home is located at 502 Horseshoe Ln, Casey, IL 62420 and is currently estimated at $55,993, approximately $84 per square foot. 502 Horseshoe Ln is a home located in Clark County with nearby schools including Monroe Elementary School and Casey-Westfield Jr-Sr High School.
Ownership History
Date
Name
Owned For
Owner Type
Purchase Details
Closed on
Oct 8, 2020
Sold by
Croy Loyd A and Croy Ann M
Bought by
Robinson Rilan and Robinson Diana
Current Estimated Value
Home Financials for this Owner
Home Financials are based on the most recent Mortgage that was taken out on this home.
Original Mortgage
$26,400
Outstanding Balance
$18,975
Interest Rate
2.9%
Mortgage Type
New Conventional
Estimated Equity
$37,018
Purchase Details
Closed on
Dec 3, 2008
Sold by
Casey State Bank
Bought by
Croy Loyd A and Croy Ann M
Home Financials for this Owner
Home Financials are based on the most recent Mortgage that was taken out on this home.
Original Mortgage
$23,120
Interest Rate
7.5%
Mortgage Type
Purchase Money Mortgage
Purchase Details
Closed on
Jul 3, 2008
Sold by
Fisher
Bought by
Casey State Bank
Purchase Details
Closed on
Feb 27, 2004
Sold by
Durnal Dennis W and Durnal Roberta J
Bought by
Fisher Janette S
Create a Home Valuation Report for This Property
The Home Valuation Report is an in-depth analysis detailing your home's value as well as a comparison with similar homes in the area
Purchase History
| Date | Buyer | Sale Price | Title Company |
|---|---|---|---|
| Robinson Rilan | $33,000 | Accommodation | |
| Croy Loyd A | $29,000 | None Available | |
| Casey State Bank | -- | None Available | |
| Fisher Janette S | $46,000 | Attorney |
Source: Public Records
Mortgage History
| Date | Status | Borrower | Loan Amount |
|---|---|---|---|
| Open | Robinson Rilan | $26,400 | |
| Previous Owner | Croy Loyd A | $23,120 |
Source: Public Records
Tax History
| Year | Tax Paid | Tax Assessment Tax Assessment Total Assessment is a certain percentage of the fair market value that is determined by local assessors to be the total taxable value of land and additions on the property. | Land | Improvement |
|---|---|---|---|---|
| 2024 | $1,081 | $13,738 | $2,613 | $11,125 |
| 2023 | $1,040 | $13,738 | $2,613 | $11,125 |
| 2022 | $1,057 | $12,266 | $2,333 | $9,933 |
| 2021 | $1,079 | $12,266 | $2,333 | $9,933 |
| 2019 | $1,105 | $11,762 | $2,333 | $9,429 |
| 2018 | $1,119 | $11,762 | $2,333 | $9,429 |
| 2017 | $1,165 | $12,349 | $2,296 | $10,053 |
| 2016 | $1,215 | $12,075 | $2,245 | $9,830 |
| 2015 | $1,174 | $12,406 | $2,307 | $10,099 |
| 2014 | $1,186 | $12,075 | $2,245 | $9,830 |
| 2013 | $1,186 | $12,300 | $2,165 | $10,135 |
Source: Public Records
Map
Nearby Homes
- 908 N Route 49
- 922 Illinois 49
- 0 Illinois 49
- 0 Highway 40 W
- 10 W Alabama Ave
- 112 NW 4th St
- 209 S Central Ave
- 706 E Madison St
- 706 E Madison Ave
- 606 E Monroe Ave
- 9 NW 4th St
- 305 SW 2nd St
- 205 W Madison Ave
- 604 S Central Ave
- 601 SW 2nd St
- 705 SW 2nd St
- 804 SW 3rd St
- 2717 E Washington Rd
- 10367 N 330th St
- 20 Ashley Ln
- 502 Horseshoe Ln
- 504 Horseshoe Ln
- 500 Horseshoe Ln
- 517 Horseshoe Ln
- 506 Horseshoe Ln
- 498 Horseshoe Ln
- 498 Horseshoe Ln
- 515 Po Box
- 501 Horseshoe Ln
- 511 Horseshoe Ln
- 505 Horseshoe Ln
- 494 Horseshoe Ln
- 507 Horseshoe Ln
- 1 Northwood Ln
- 500 Deere Run Ln
- 502 Deere Run Ln
- 61 Po Box
- 402 Deere Run Ln
- 5 Staley Ave
- 398 Deere Run Ln
Your Personal Tour Guide
Ask me questions while you tour the home.