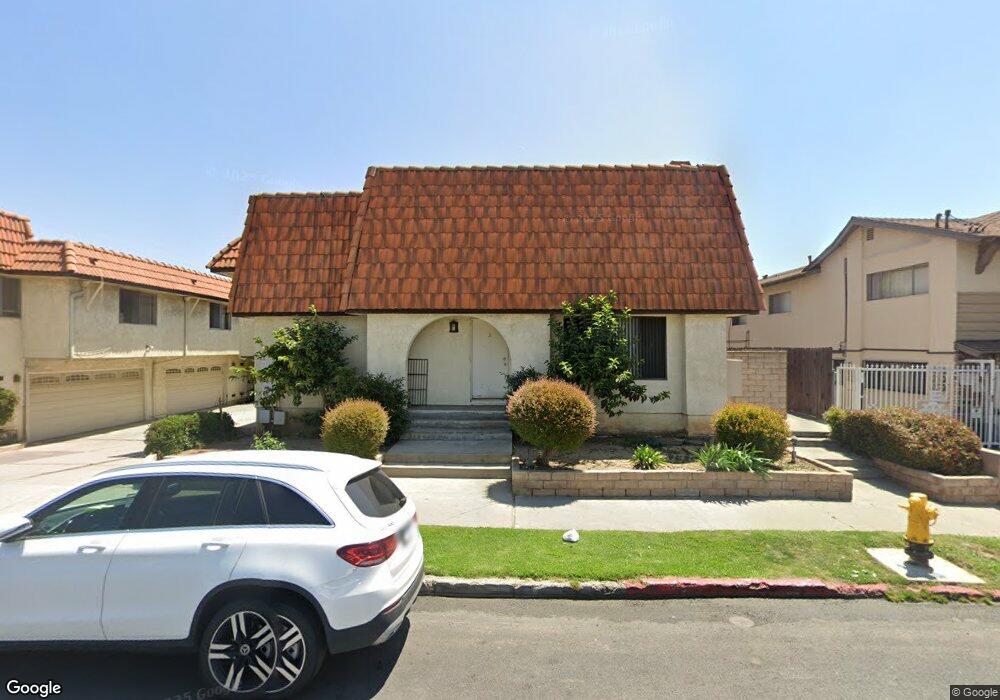
502 N Nicholson Ave Unit D Monterey Park, CA 91755
Estimated Value: $707,705 - $795,000
3
Beds
3
Baths
1,514
Sq Ft
$504/Sq Ft
Est. Value
About This Home
This home is located at 502 N Nicholson Ave Unit D, Monterey Park, CA 91755 and is currently estimated at $763,676, approximately $504 per square foot. 502 N Nicholson Ave Unit D is a home located in Los Angeles County with nearby schools including Ynez Elementary School, Mark Keppel High School, and St. Stephen Martyr School.
Ownership History
Date
Name
Owned For
Owner Type
Purchase Details
Closed on
Jul 20, 2007
Sold by
Quach Curtis Meler
Bought by
Quach Jimmy
Current Estimated Value
Purchase Details
Closed on
Aug 22, 2005
Sold by
Quach Curtis Meler
Bought by
Quach Curtis Meler and Quach Jimmy
Purchase Details
Closed on
Feb 28, 2001
Sold by
Hong Susan
Bought by
Quach Curtis Meier
Home Financials for this Owner
Home Financials are based on the most recent Mortgage that was taken out on this home.
Original Mortgage
$78,000
Outstanding Balance
$28,317
Interest Rate
6.98%
Estimated Equity
$735,359
Purchase Details
Closed on
Feb 4, 1994
Sold by
Huynh Tai
Bought by
Hong Susan
Home Financials for this Owner
Home Financials are based on the most recent Mortgage that was taken out on this home.
Original Mortgage
$105,000
Interest Rate
7.24%
Create a Home Valuation Report for This Property
The Home Valuation Report is an in-depth analysis detailing your home's value as well as a comparison with similar homes in the area
Home Values in the Area
Average Home Value in this Area
Purchase History
| Date | Buyer | Sale Price | Title Company |
|---|---|---|---|
| Quach Jimmy | -- | None Available | |
| Quach Curtis Meler | -- | -- | |
| Quach Curtis Meier | $138,000 | Investors Title Company | |
| Hong Susan | -- | Investors Title Company |
Source: Public Records
Mortgage History
| Date | Status | Borrower | Loan Amount |
|---|---|---|---|
| Open | Quach Curtis Meier | $78,000 | |
| Previous Owner | Hong Susan | $105,000 |
Source: Public Records
Tax History Compared to Growth
Tax History
| Year | Tax Paid | Tax Assessment Tax Assessment Total Assessment is a certain percentage of the fair market value that is determined by local assessors to be the total taxable value of land and additions on the property. | Land | Improvement |
|---|---|---|---|---|
| 2025 | $5,014 | $382,411 | $229,185 | $153,226 |
| 2024 | $5,014 | $374,914 | $224,692 | $150,222 |
| 2023 | $4,911 | $367,564 | $220,287 | $147,277 |
| 2022 | $4,679 | $360,358 | $215,968 | $144,390 |
| 2021 | $4,618 | $353,293 | $211,734 | $141,559 |
| 2019 | $4,453 | $342,815 | $205,454 | $137,361 |
| 2018 | $4,451 | $336,094 | $201,426 | $134,668 |
| 2016 | $4,116 | $323,045 | $193,605 | $129,440 |
| 2015 | $4,051 | $318,193 | $190,697 | $127,496 |
| 2014 | $3,996 | $311,961 | $186,962 | $124,999 |
Source: Public Records
Map
Nearby Homes
- 433 N Alhambra Ave Unit C
- 223 E Emerson Ave
- 522 N Nicholson Ave Unit A
- 522 N Nicholson Ave Unit A
- 406 N Lincoln Ave Unit A
- 303 N Nicholson Ave Unit 308
- 230 N Nicholson Ave Unit C
- 208 N Nicholson Ave Unit B
- 203 N Nicholson Ave
- 197 N Nicholson Ave
- 215 N Lincoln Ave
- 425 N Rural Dr
- 123 N Alhambra Ave Unit D
- 321 N Orange Ave Unit 209
- 321 N Orange Ave Unit 103
- 112 S Sierra Vista St
- 305 N Baltimore Ave Unit C
- 215 W Garcelon Ave
- 117 Gladys Ave
- 2037 S 3rd St
- 502 N Nicholson Ave Unit A
- 502 N Nicholson Ave Unit B
- 502 N Nicholson Ave Unit C
- 502 N Nicholson Ave Unit E
- 506 N Nicholson Ave
- 500 N Nicholson Ave Unit A
- 500 N Nicholson Ave Unit B
- 500 N Nicholson Ave Unit C
- 500 N Nicholson Ave Unit D
- 508 N Nicholson Ave Unit E
- 508 N Nicholson Ave Unit D
- 508 N Nicholson Ave Unit C
- 508 N Nicholson Ave Unit B
- 508 N Nicholson Ave Unit A
- 506 N Nicholson Ave Unit D
- 506 N Nicholson Ave Unit C
- 506 N Nicholson Ave Unit B
- 506 N Nicholson Ave Unit A
- 422 N Nicholson Ave Unit E
- 422 N Nicholson Ave Unit D