502 N Via Belmonte Ct Arroyo Grande, CA 93420
Estimated Value: $1,973,319 - $2,308,000
4
Beds
3
Baths
3,920
Sq Ft
$545/Sq Ft
Est. Value
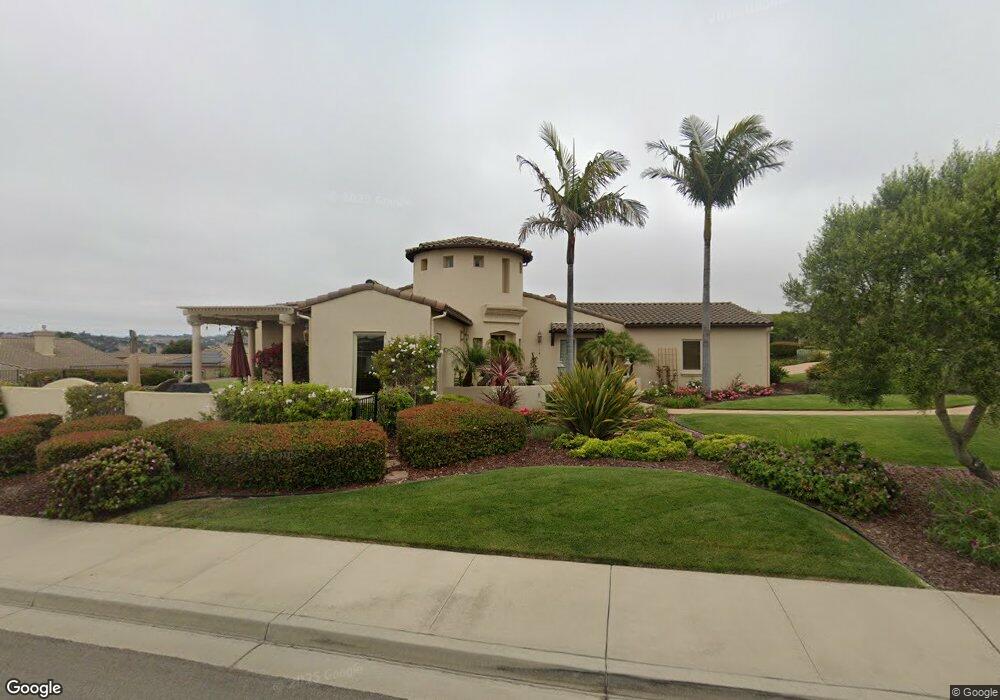
About This Home
This home is located at 502 N Via Belmonte Ct, Arroyo Grande, CA 93420 and is currently estimated at $2,135,580, approximately $544 per square foot. 502 N Via Belmonte Ct is a home located in San Luis Obispo County with nearby schools including Harloe Elementary School, Paulding Middle School, and Arroyo Grande High School.
Ownership History
Date
Name
Owned For
Owner Type
Purchase Details
Closed on
Oct 10, 2019
Sold by
Feliksa Michael J and Feliksa Elvira
Bought by
Feliksa Michael J and Feliksa Elvira E
Current Estimated Value
Purchase Details
Closed on
Feb 23, 2016
Sold by
Steward G Anthony and Steward Sheila G
Bought by
Feliksa Michael J and Feliksa Elvira
Home Financials for this Owner
Home Financials are based on the most recent Mortgage that was taken out on this home.
Original Mortgage
$561,200
Interest Rate
3.68%
Mortgage Type
New Conventional
Purchase Details
Closed on
Sep 24, 2001
Sold by
Jh Land Partnership Lp
Bought by
Steward G Anthony and Steward Sheila G
Create a Home Valuation Report for This Property
The Home Valuation Report is an in-depth analysis detailing your home's value as well as a comparison with similar homes in the area
Home Values in the Area
Average Home Value in this Area
Purchase History
| Date | Buyer | Sale Price | Title Company |
|---|---|---|---|
| Feliksa Michael J | -- | None Available | |
| Feliksa Michael J | $1,300,000 | Fidelity National Title Co | |
| Steward G Anthony | $840,000 | First American Title Ins Co |
Source: Public Records
Mortgage History
| Date | Status | Borrower | Loan Amount |
|---|---|---|---|
| Previous Owner | Feliksa Michael J | $561,200 |
Source: Public Records
Tax History Compared to Growth
Tax History
| Year | Tax Paid | Tax Assessment Tax Assessment Total Assessment is a certain percentage of the fair market value that is determined by local assessors to be the total taxable value of land and additions on the property. | Land | Improvement |
|---|---|---|---|---|
| 2025 | $15,846 | $1,538,931 | $651,086 | $887,845 |
| 2024 | $15,662 | $1,508,757 | $638,320 | $870,437 |
| 2023 | $15,662 | $1,479,174 | $625,804 | $853,370 |
| 2022 | $15,424 | $1,450,172 | $613,534 | $836,638 |
| 2021 | $15,393 | $1,421,738 | $601,504 | $820,234 |
| 2020 | $13,932 | $1,289,000 | $545,000 | $744,000 |
| 2019 | $14,108 | $1,289,000 | $545,000 | $744,000 |
| 2018 | $13,786 | $1,250,000 | $530,000 | $720,000 |
| 2017 | $14,674 | $1,326,000 | $561,000 | $765,000 |
| 2016 | $11,162 | $1,048,257 | $436,773 | $611,484 |
| 2015 | $11,068 | $1,032,512 | $430,213 | $602,299 |
| 2014 | $10,665 | $1,012,287 | $421,786 | $590,501 |
Source: Public Records
Map
Nearby Homes
- 467 Del Sur
- 852 Glenoak Dr
- 820 Farnsworth Dr Unit 206
- 317 Sunrise Terrace
- 261 Haven Ct
- 432 California St
- 256 Candice Ct
- 324 Short St
- 604 Hillside Ct
- 807 Valley Rd
- 00 Los Berros Rd
- 829 Pearl Dr
- 662 Woodland Ct
- 411 Cornwall Ave
- 212 Miller Way
- 655 S Halcyon Rd Unit 16
- 655 S Halcyon Rd Unit 7
- 655 S Halcyon Rd Unit 26
- 950 Huasna Rd Unit 41
- 950 Huasna Rd Unit 20
- 501 N Via Firenze Ct
- 506 N Via Belmonte Ct Unit Via
- 506 N Via Belmonte Ct
- 604 S Via Belmonte Ct
- 510 N Via Belmonte Ct
- 505 N Via Firenze Ct
- 603 S Via Firenze Ct
- 503 N Via Belmonte Ct Unit Via
- 503 N Via Belmonte Ct
- 605 S Via Belmonte Ct
- 509 N Via Belmonte Ct
- 612 S Via Belmonte Ct
- 611 S Via Firenze Ct
- 615 S Via Belmonte Ct
- 602 S Via Firenze Ct
- 504 N Via Firenze Ct
- 618 S Via Belmonte Ct
- 500 N Via Firenze Ct
- 616 S Via Firenze Ct
- 705 Castillo Del Mar