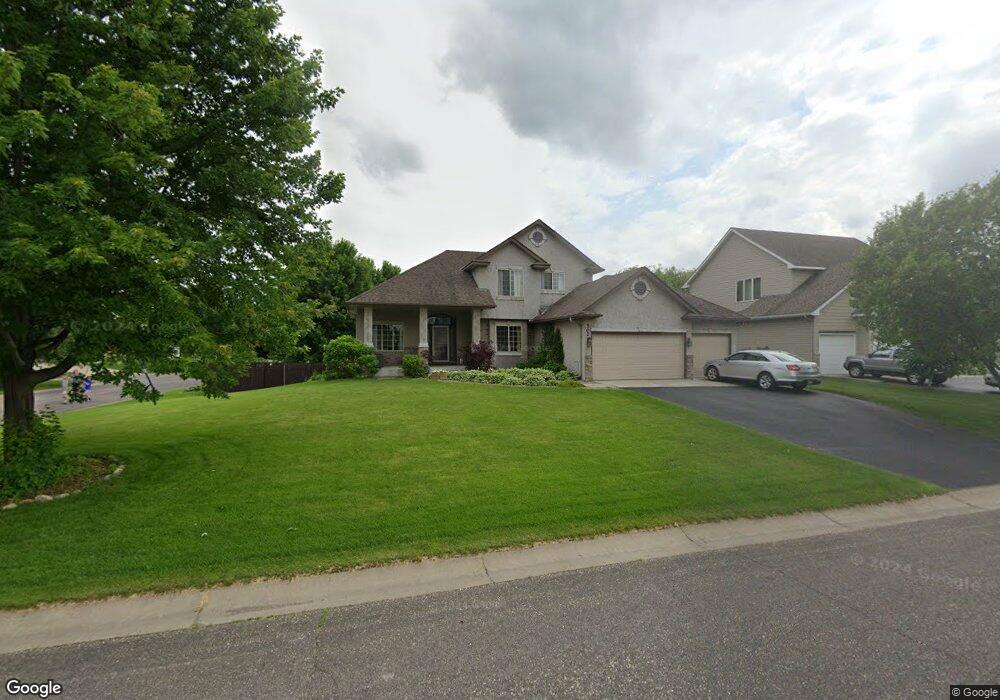
502 Pebble Rd N Champlin, MN 55316
Estimated Value: $506,000 - $572,000
4
Beds
4
Baths
2,950
Sq Ft
$179/Sq Ft
Est. Value
About This Home
This home is located at 502 Pebble Rd N, Champlin, MN 55316 and is currently estimated at $527,032, approximately $178 per square foot. 502 Pebble Rd N is a home located in Hennepin County with nearby schools including Champlin-Brooklyn Park Academy, Jackson Middle School, and Champlin Park High School.
Ownership History
Date
Name
Owned For
Owner Type
Purchase Details
Closed on
Jul 21, 2015
Sold by
Ihry Kyle R and Ihry Kelly
Bought by
Zabel Jay and Zabel Amanda
Current Estimated Value
Home Financials for this Owner
Home Financials are based on the most recent Mortgage that was taken out on this home.
Original Mortgage
$346,750
Outstanding Balance
$271,035
Interest Rate
4.01%
Mortgage Type
New Conventional
Estimated Equity
$255,997
Purchase Details
Closed on
Jun 23, 2006
Sold by
Mingo Rick and Mingo Laurie
Bought by
Ihry Kyle R
Purchase Details
Closed on
Aug 13, 2003
Sold by
T/C Builders Inc
Bought by
Crandall Laurie A and Crandall Rick J
Create a Home Valuation Report for This Property
The Home Valuation Report is an in-depth analysis detailing your home's value as well as a comparison with similar homes in the area
Home Values in the Area
Average Home Value in this Area
Purchase History
| Date | Buyer | Sale Price | Title Company |
|---|---|---|---|
| Zabel Jay | $365,000 | Cornerstone Title Inc | |
| Ihry Kyle R | $400,000 | -- | |
| Crandall Laurie A | $312,083 | -- |
Source: Public Records
Mortgage History
| Date | Status | Borrower | Loan Amount |
|---|---|---|---|
| Open | Zabel Jay | $346,750 |
Source: Public Records
Tax History
| Year | Tax Paid | Tax Assessment Tax Assessment Total Assessment is a certain percentage of the fair market value that is determined by local assessors to be the total taxable value of land and additions on the property. | Land | Improvement |
|---|---|---|---|---|
| 2024 | $5,853 | $490,500 | $103,500 | $387,000 |
| 2023 | $5,655 | $492,600 | $103,500 | $389,100 |
| 2022 | $4,941 | $481,000 | $105,000 | $376,000 |
| 2021 | $4,726 | $393,000 | $82,000 | $311,000 |
| 2020 | $4,732 | $375,000 | $81,000 | $294,000 |
| 2019 | $4,844 | $367,000 | $77,000 | $290,000 |
| 2018 | $4,772 | $369,000 | $84,000 | $285,000 |
| 2017 | $4,618 | $343,000 | $81,000 | $262,000 |
| 2016 | $4,112 | $298,000 | $81,000 | $217,000 |
| 2015 | $4,128 | $298,000 | $81,000 | $217,000 |
| 2014 | -- | $248,000 | $52,000 | $196,000 |
Source: Public Records
Map
Nearby Homes
- 1125 Independence Ln N
- 1032 Orleans Ln N
- 969 Creekwood Dr N
- 126 Hayden Lake Rd E
- 704 Keniston St N
- 701 Parkview Ln
- 516 Dayton Rd
- 12129 Yukon Ave N
- 10300 Parkview Ln
- 8424 Yukon Cir N
- 12933 Burr Oak Ln N
- 11916 Emery Village Dr N
- 12972 Bauer Dr N
- 809 Bradford Ave
- 12985 Bauer Dr N
- 11907 Emery Village Dr N
- 11875 Emery Village Dr N Unit 2503
- 705 W River Pkwy
- 8333 Emery Pkwy N
- 251 Revere Ln N
- 508 Pebble Rd N
- 1220 Pebble Ct N
- 420 Pebble Rd N
- 514 Pebble Rd N
- 507 Pebble Rd N
- 1226 Pebble Ct N
- 423 Pebble Rd N
- 1221 Pebble Ct N
- 513 Pebble Rd N
- 410 Pebble Rd N
- 1232 Pebble Ct N
- 1213 Cobblestone Rd N
- 417 Pebble Rd N
- 1219 Cobblestone Rd N
- 519 Pebble Rd N
- 1227 Pebble Ct N
- 1225 Cobblestone Rd N
- 404 Pebble Rd N
- 411 Pebble Rd N
- 525 Pebble Rd N
Your Personal Tour Guide
Ask me questions while you tour the home.