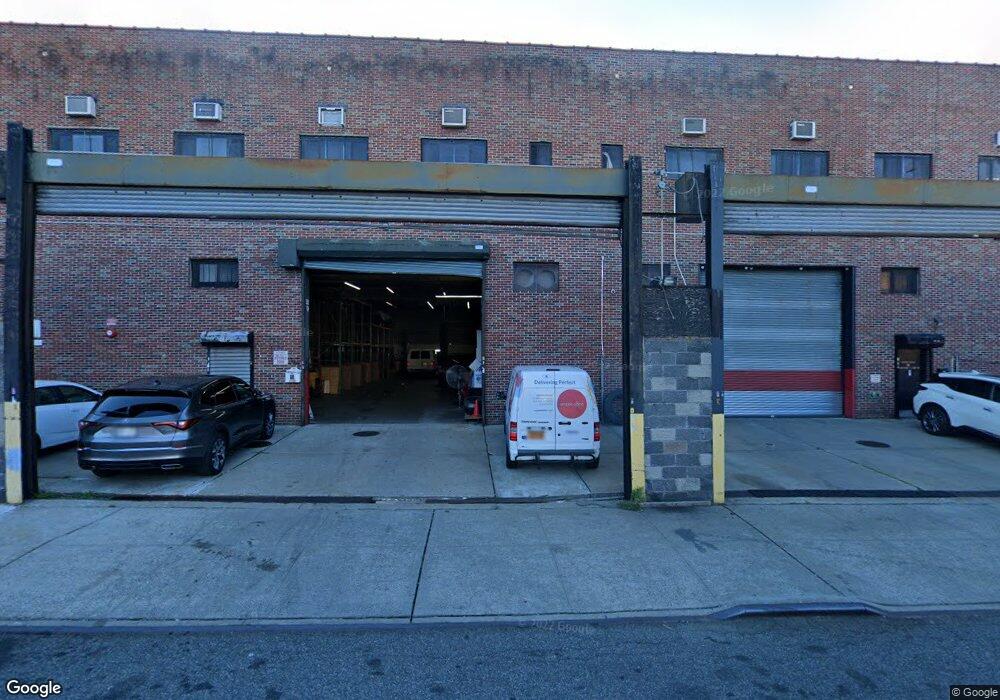
5021 49th St Flushing, NY 11377
Sunnyside Neighborhood
--
Bed
--
Bath
22,500
Sq Ft
0.6
Acres
About This Home
This home is located at 5021 49th St, Flushing, NY 11377. 5021 49th St is a home located in Queens County with nearby schools including P.S. 199 Maurice A Fitzgerald, William Cullen Bryant High School, and Razi School.
Ownership History
Date
Name
Owned For
Owner Type
Purchase Details
Closed on
Jan 14, 2004
Sold by
New York City Industrial Development Age
Bought by
50-19 49Th Street Llc
Home Financials for this Owner
Home Financials are based on the most recent Mortgage that was taken out on this home.
Original Mortgage
$718,842
Interest Rate
5.82%
Mortgage Type
Commercial
Purchase Details
Closed on
Aug 17, 1999
Sold by
50-19 49Th Street Llc
Bought by
New York Industrial Development Agency
Home Financials for this Owner
Home Financials are based on the most recent Mortgage that was taken out on this home.
Original Mortgage
$650,000
Interest Rate
7.85%
Mortgage Type
Commercial
Purchase Details
Closed on
Oct 13, 1995
Sold by
Ondrey Catherine
Bought by
Broma Realty Inc
Home Financials for this Owner
Home Financials are based on the most recent Mortgage that was taken out on this home.
Original Mortgage
$250,000
Interest Rate
7.47%
Mortgage Type
Seller Take Back
Create a Home Valuation Report for This Property
The Home Valuation Report is an in-depth analysis detailing your home's value as well as a comparison with similar homes in the area
Home Values in the Area
Average Home Value in this Area
Purchase History
| Date | Buyer | Sale Price | Title Company |
|---|---|---|---|
| 50-19 49Th Street Llc | -- | -- | |
| New York Industrial Development Agency | -- | Chicago Title Insurance Co | |
| 50-19 49Th Street Llc | $600,000 | -- | |
| Broma Realty Inc | $450,000 | Chicago Title Insurance Co |
Source: Public Records
Mortgage History
| Date | Status | Borrower | Loan Amount |
|---|---|---|---|
| Previous Owner | 50-19 49Th Street Llc | $718,842 | |
| Previous Owner | 50-19 49Th Street Llc | $650,000 | |
| Previous Owner | Broma Realty Inc | $250,000 |
Source: Public Records
Tax History Compared to Growth
Tax History
| Year | Tax Paid | Tax Assessment Tax Assessment Total Assessment is a certain percentage of the fair market value that is determined by local assessors to be the total taxable value of land and additions on the property. | Land | Improvement |
|---|---|---|---|---|
| 2025 | $165,251 | $1,626,740 | $355,500 | $1,271,240 |
| 2024 | $165,251 | $1,560,150 | $355,500 | $1,204,650 |
| 2023 | $154,460 | $1,458,270 | $320,130 | $1,138,140 |
| 2022 | $143,789 | $1,427,400 | $355,500 | $1,071,900 |
| 2021 | $133,089 | $1,421,550 | $355,500 | $1,066,050 |
| 2020 | $121,026 | $1,451,250 | $355,500 | $1,095,750 |
| 2019 | $105,943 | $1,234,800 | $178,650 | $1,056,150 |
| 2018 | $96,679 | $919,526 | $178,650 | $740,876 |
| 2017 | $89,014 | $846,626 | $178,650 | $667,976 |
| 2016 | $84,869 | $846,626 | $178,650 | $667,976 |
| 2015 | $37,826 | $823,136 | $178,650 | $644,486 |
| 2014 | $37,826 | $823,226 | $178,650 | $644,576 |
Source: Public Records
Map
Nearby Homes
- 50-43 48th St
- 50-56 47th St
- 51-17 47th St Unit 2
- 50-05 46th St
- 48-41 45th St
- 48-50 44th St Unit 4E
- 48-56 44th St Unit 2H
- 48-55 43rd St Unit 4H
- 5068 43rd St
- 48-19 43rd St Unit 4D
- 4310 48th Ave Unit 2A
- 4310 48th Ave Unit 2F
- 43-10 48th Ave Unit 2A
- 43-10 48th Ave Unit 2P
- 43-10 48th Ave Unit . 2J
- 48-41 43rd St Unit 5F
- 48-17 42nd St Unit 2C
- 48-17 42nd St Unit 7B
- 48-23 42nd St Unit 1 J
- 48-01 42nd St Unit 5D