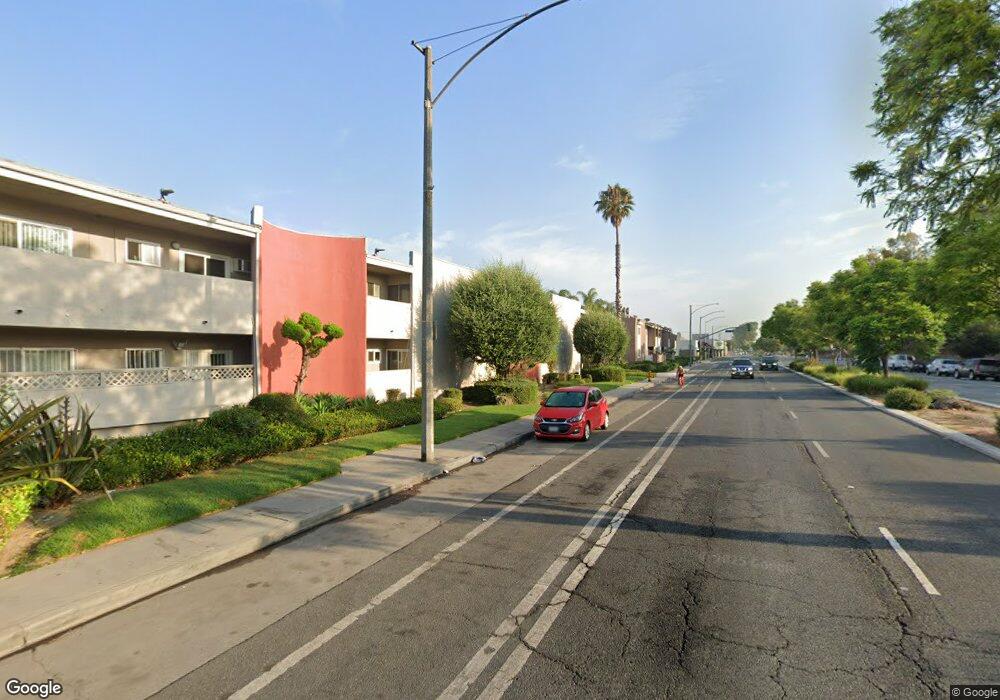
Town and Country 5021 Atlantic Ave Unit 3 Long Beach, CA 90805
Addams NeighborhoodEstimated Value: $325,000 - $374,000
2
Beds
1
Bath
784
Sq Ft
$447/Sq Ft
Est. Value
About This Home
This home is located at 5021 Atlantic Ave Unit 3, Long Beach, CA 90805 and is currently estimated at $350,406, approximately $446 per square foot. 5021 Atlantic Ave Unit 3 is a home located in Los Angeles County with nearby schools including Dooley Elementary School, Jordan High School, and Oakwood Academy Elementary.
Ownership History
Date
Name
Owned For
Owner Type
Purchase Details
Closed on
Oct 9, 2023
Sold by
So Davis
Bought by
Keo Alexander S
Current Estimated Value
Purchase Details
Closed on
Jul 16, 2020
Sold by
Keo Alexander S
Bought by
Keo Alexander and So Davis
Purchase Details
Closed on
Jun 26, 2000
Sold by
Perez Joseph
Bought by
Perez Linnea Joy
Home Financials for this Owner
Home Financials are based on the most recent Mortgage that was taken out on this home.
Original Mortgage
$52,800
Interest Rate
9.75%
Purchase Details
Closed on
Jun 8, 2000
Sold by
Fredinburg Nancy A
Bought by
Keo Alexander S
Home Financials for this Owner
Home Financials are based on the most recent Mortgage that was taken out on this home.
Original Mortgage
$52,800
Interest Rate
9.75%
Purchase Details
Closed on
Apr 9, 1992
Sold by
Fredinburg Robert J
Bought by
Fredinburg Nancy Ann
Create a Home Valuation Report for This Property
The Home Valuation Report is an in-depth analysis detailing your home's value as well as a comparison with similar homes in the area
Home Values in the Area
Average Home Value in this Area
Purchase History
| Date | Buyer | Sale Price | Title Company |
|---|---|---|---|
| Keo Alexander S | -- | None Listed On Document | |
| Keo Alexander | -- | None Available | |
| Perez Linnea Joy | -- | Lawyers Title Company | |
| Keo Alexander S | $66,000 | Lawyers Title Company | |
| Fredinburg Nancy Ann | -- | -- |
Source: Public Records
Mortgage History
| Date | Status | Borrower | Loan Amount |
|---|---|---|---|
| Previous Owner | Keo Alexander S | $52,800 |
Source: Public Records
Tax History Compared to Growth
Tax History
| Year | Tax Paid | Tax Assessment Tax Assessment Total Assessment is a certain percentage of the fair market value that is determined by local assessors to be the total taxable value of land and additions on the property. | Land | Improvement |
|---|---|---|---|---|
| 2025 | $1,463 | $99,426 | $19,877 | $79,549 |
| 2024 | $1,463 | $97,478 | $19,488 | $77,990 |
| 2023 | $1,436 | $95,567 | $19,106 | $76,461 |
| 2022 | $1,354 | $93,694 | $18,732 | $74,962 |
| 2021 | $1,321 | $91,858 | $18,365 | $73,493 |
| 2019 | $1,302 | $89,135 | $17,821 | $71,314 |
| 2018 | $1,254 | $87,388 | $17,472 | $69,916 |
| 2016 | $1,154 | $83,997 | $16,795 | $67,202 |
| 2015 | $1,112 | $82,736 | $16,543 | $66,193 |
| 2014 | $1,111 | $81,116 | $16,219 | $64,897 |
Source: Public Records
About Town and Country
Map
Nearby Homes
- 5050 Linden Ave Unit 75
- 765 E Silva St
- 803 E Silva St
- 312 E Peace St
- 223 E Pleasant St
- 358 E 53rd St
- 5320 Lime Ave
- 326 E Plymouth St
- 1098 E Ridgewood St
- 1124 E Ridgewood St
- 4807 Bentree Ave
- 4521 Whaley Ave
- 12 W Pleasant St
- 30 W 49th St
- 5447 Lime Ave
- 60 E Platt St
- 5444 Lime Ave
- 5355 Pine Ave
- 4903 Brayton Ave
- 5341 Cerritos Ave
- 5021 Atlantic Ave
- 5021 Atlantic Ave Unit 52
- 5021 Atlantic Ave Unit 58
- 5021 Atlantic Ave Unit 57
- 5021 Atlantic Ave Unit 55
- 5021 Atlantic Ave Unit 54
- 5021 Atlantic Ave Unit 4
- 5021 Atlantic Ave Unit 2
- 5021 Atlantic Ave Unit 1
- 5021 Atlantic Ave Unit 36
- 5021 Atlantic Ave Unit 35
- 5021 Atlantic Ave Unit 34
- 5021 Atlantic Ave Unit 33
- 5021 Atlantic Ave Unit 32
- 5021 Atlantic Ave Unit 31
- 5021 Atlantic Ave Unit 30
- 5021 Atlantic Ave Unit 29
- 5021 Atlantic Ave Unit 28
- 5021 Atlantic Ave Unit 27