


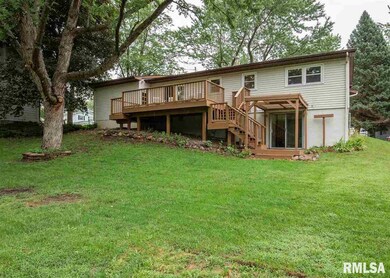

5022 Northbrook Ct Davenport, IA 52806
North Side Neighborhood
3
Beds
2
Baths
1,034
Sq Ft
7,841
Sq Ft Lot
About This Home
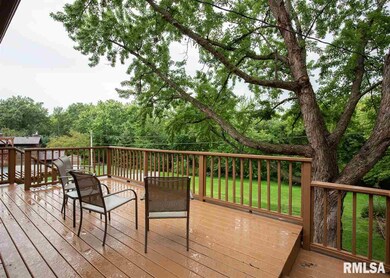
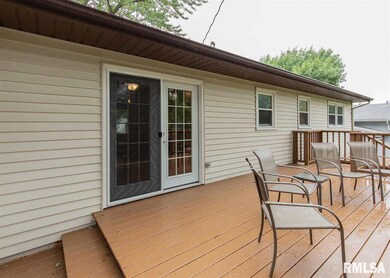
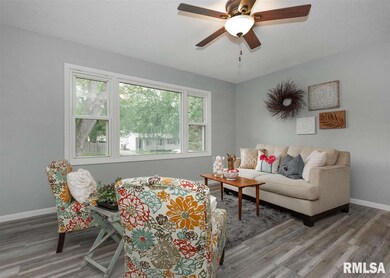
As of November 2022I am ready and looking for my new owner. Large rooms, breakfast bar in Kitchen, new appliances. Finished walk out basement with Large rec room, 3/4 bath. 2 tier decks for plenty of entertainment space or just relax on after a long day.
Last Agent to Sell the Property
KW 1Advantage License #B44293000/471.021466 Listed on: 09/08/2018
Home Details
Home Type
- Single Family
Est. Annual Taxes
- $2,718
Year Built
- Built in 1968
Home Design
- Ranch Style House
Kitchen
- Oven or Range
- Dishwasher
Additional Features
- 2 Full Bathrooms
- Sump Pump
- Deck
Ownership History
Date
Name
Owned For
Owner Type
Purchase Details
Listed on
Sep 15, 2022
Closed on
Oct 31, 2022
Sold by
Fenner Angela and Fenner Jeffery
Bought by
Asanuma Asau and Asanuma Dildanges F
Seller's Agent
Ana True
eXp Realty
Buyer's Agent
Melissa Crawford
eXp Realty
List Price
$187,000
Sold Price
$192,000
Premium/Discount to List
$5,000
2.67%
Views
60
Home Financials for this Owner
Home Financials are based on the most recent Mortgage that was taken out on this home.
Avg. Annual Appreciation
4.67%
Original Mortgage
$196,119
Outstanding Balance
$190,163
Interest Rate
6.7%
Mortgage Type
VA
Estimated Equity
$27,191
Purchase Details
Listed on
Sep 8, 2018
Closed on
Oct 18, 2018
Sold by
Twin Bridges Redevelopment Llc
Bought by
Fenner Angela and Fenner Jeffery
Seller's Agent
Deb Haussmann
KW 1Advantage
Buyer's Agent
Amanda Hodge
Currents and Keys Realty
List Price
$150,000
Sold Price
$147,000
Premium/Discount to List
-$3,000
-2%
Home Financials for this Owner
Home Financials are based on the most recent Mortgage that was taken out on this home.
Avg. Annual Appreciation
6.80%
Original Mortgage
$139,650
Interest Rate
4.85%
Purchase Details
Closed on
Mar 30, 2015
Sold by
Anderson Gregory S and Anderson Lynnette C
Bought by
Anderson Brent
Similar Homes in Davenport, IA
-
$119,900
- 3 Beds
- 1 Bath
- 864 Sq Ft
- 3014 W 1st St
- Davenport, IA
Affordable! One floor living for this 3BR/1Bath Ranch home situated just North of Telegraph Road. Situated on a terraced lot which includes a pristine, large, fenced, treed yard. This home includes a spacious front living room which opens to a large, eat-in kitchen with range/oven, dishwasher, refrigerator, microwave, washer, and dryer. Laundry is located just off the kitchen area. Kitchen
David Maubach Mel Foster Co. Davenport
-
$179,900
- 4 Beds
- 2 Baths
- 1,614 Sq Ft
- 325 W 64th St
- Davenport, IA
Nice 4 bedroom 2 full bath fenced in yard large one car garage. Use showingtime to setup all showings
Chris Holvoet 3% Listing Company, LLC
-
$169,900
- 3 Beds
- 1 Bath
- 925 Sq Ft
- 1729 Welshire Dr
- Davenport, IA
Gorgeous three bedroom, one bath, Northwest Davenport Home, with a spacious yard. This home is the definition of turn-key. The interior of the home has been totally refreshed, with new paint, flooring, trim, doors, cabinets, granite countertops, stainless steel appliances, a updated bathroom, new electrical panel, new water heater, and more. The exterior of the home features a cozy front porch,
Michael Rebitzer All City Realty
-
$185,000
- 4 Beds
- 3 Baths
- 1,738 Sq Ft
- 1811 Valley Dr
- Davenport, IA
Refinished 4-bedroom home with additional 5th (non-conforming) room. Nice size yard and is located in NW Davenport. Home is Realtor owned. Buyers and buyers agents are to verify measurements. eXp does not hold earnest money.
Jason Carrillo eXp Realty
-
$152,500
- 2 Beds
- 1 Bath
- 1,008 Sq Ft
- 612 W 31st St
- Davenport, IA
Wow! This immaculate 2-bedroom home boasts an updated bathroom and kitchen, along with a fenced yard. It's ideally located close to parks and bike trails. The awesome open kitchen and great room area provide a fantastic living space. All appliances are included. Plus, the basement has been draintiled, and the roof was replaced in 2016. No disappointments here! Must See!
Jeffrey Wehr Ruhl&Ruhl REALTORS Bettendorf
-
$158,000
- 2 Beds
- 1 Bath
- 1,049 Sq Ft
- 235 W 32nd St
- Davenport, IA
Welcome to 235 W 32nd Street, a recently renovated, delightful property currently thriving as a Short Term Rental. This inviting home combines modern amenities with classic charm, making it an ideal retreat for travelers or future homeowners seeking comfort and convenience. Featuring an open floor plan, the living area is designed for relaxation and socializing. Large windows flood the space with
Emilie Lawrence Epique Realty
-
$175,000
- 3 Beds
- 1 Bath
- 1,061 Sq Ft
- 3433 Washington St
- Davenport, IA
Charming Fully Remodeled 3-Bedroom Home with Modern Upgrades! Welcome to this beautifully renovated 3-bedroom, 1-bath home offering 1,061 sq ft of thoughtfully updated living space. Perfectly blending classic charm with modern convenience, this home has been completely refreshed from top to bottom. The heart of the home is the stunning new kitchen featuring sleek quartz countertops, all-new
JOSH CUMMINGS Ruhl&Ruhl REALTORS Muscatine
Create a Home Valuation Report for This Property
The Home Valuation Report is an in-depth analysis detailing your home's value as well as a comparison with similar homes in the area
Home Values in the Area
Average Home Value in this Area
Purchase History
| Date | Type | Sale Price | Title Company |
|---|---|---|---|
| Warranty Deed | $192,000 | -- | |
| Deed | -- | -- | |
| Warranty Deed | $100,000 | None Available |
Source: Public Records
Mortgage History
| Date | Status | Loan Amount | Loan Type |
|---|---|---|---|
| Open | $196,119 | VA | |
| Previous Owner | $139,650 | No Value Available | |
| Previous Owner | -- | No Value Available | |
| Previous Owner | $139,650 | Stand Alone Refi Refinance Of Original Loan | |
| Previous Owner | $92,500 | Credit Line Revolving |
Source: Public Records
Property History
| Date | Event | Price | Change | Sq Ft Price |
|---|---|---|---|---|
| 07/12/2025 07/12/25 | For Sale | $225,000 | +17.2% | $131 / Sq Ft |
| 11/01/2022 11/01/22 | Sold | $192,000 | +2.7% | $112 / Sq Ft |
| 09/17/2022 09/17/22 | Pending | -- | -- | -- |
| 09/15/2022 09/15/22 | For Sale | $187,000 | +27.2% | $109 / Sq Ft |
| 10/12/2018 10/12/18 | Sold | $147,000 | -2.0% | $142 / Sq Ft |
| 09/12/2018 09/12/18 | Pending | -- | -- | -- |
| 09/08/2018 09/08/18 | For Sale | $150,000 | -- | $145 / Sq Ft |
Source: RMLS Alliance
Tax History Compared to Growth
Tax History
| Year | Tax Paid | Tax Assessment Tax Assessment Total Assessment is a certain percentage of the fair market value that is determined by local assessors to be the total taxable value of land and additions on the property. | Land | Improvement |
|---|---|---|---|---|
| 2024 | $2,934 | $178,690 | $34,650 | $144,040 |
| 2023 | $3,034 | $178,690 | $34,650 | $144,040 |
| 2022 | $3,046 | $150,920 | $25,200 | $125,720 |
| 2021 | $3,046 | $150,920 | $25,200 | $125,720 |
| 2020 | $2,844 | $139,670 | $25,200 | $114,470 |
| 2019 | $3,206 | $132,520 | $25,200 | $107,320 |
| 2018 | $1,136 | $132,520 | $25,200 | $107,320 |
| 2017 | $2,704 | $132,520 | $25,200 | $107,320 |
| 2016 | $2,733 | $127,410 | $0 | $0 |
| 2015 | $2,698 | $126,930 | $0 | $0 |
| 2014 | $2,626 | $126,930 | $0 | $0 |
| 2013 | $2,576 | $0 | $0 | $0 |
| 2012 | -- | $110,220 | $26,020 | $84,200 |
Source: Public Records
Agents Affiliated with this Home
-
Melissa Crawford
Seller's Agent in 2025
Melissa Crawford
eXp Realty
(563) 260-3021
21 in this area
147 Total Sales
-
Ana True
Seller's Agent in 2022
Ana True
eXp Realty
(563) 940-0799
13 in this area
206 Total Sales
-
Deb Haussmann
Seller's Agent in 2018
Deb Haussmann
KW 1Advantage
(563) 343-4747
12 in this area
149 Total Sales
-
Amanda Hodge
Buyer's Agent in 2018
Amanda Hodge
Currents and Keys Realty
(309) 948-3189
9 in this area
191 Total Sales
Map
Source: RMLS Alliance
MLS Number: RMAQC4196223
APN: P1111D11
Disclaimer: Certain information contained herein is derived from information provided by parties other than Homes.com. All information provided is deemed reliable, but is not guaranteed to be accurate and should be independently verified.
![]() IDX information is provided exclusively for personal, non-commercial use, and may not be used for any purpose other than to identify prospective properties consumers may be interested in purchasing. Information is deemed reliable but not guaranteed.
IDX information is provided exclusively for personal, non-commercial use, and may not be used for any purpose other than to identify prospective properties consumers may be interested in purchasing. Information is deemed reliable but not guaranteed.
Nearby Homes
- 315 Colony Dr
- 237 Colony Dr
- 4725 N Harrison St
- 4804 Northwest Blvd
- 4815 Willow Cir
- 4730 Willow Cir
- 108 Colony Dr
- 4612 Marquette St
- 1134 W 53rd St
- 732 W 59th St
- 1426 W 48th St
- 1425 W 48th St
- 4023 Lillie Ave Unit 504
- 1511 W 48th St
- 4015 Lillie Ave Unit 106
- 6109 Western Ave
- 4011 Lillie Ave Unit 106
- 6217 Western Ave
- 6127 Fair Ave
- 325 W 64th St