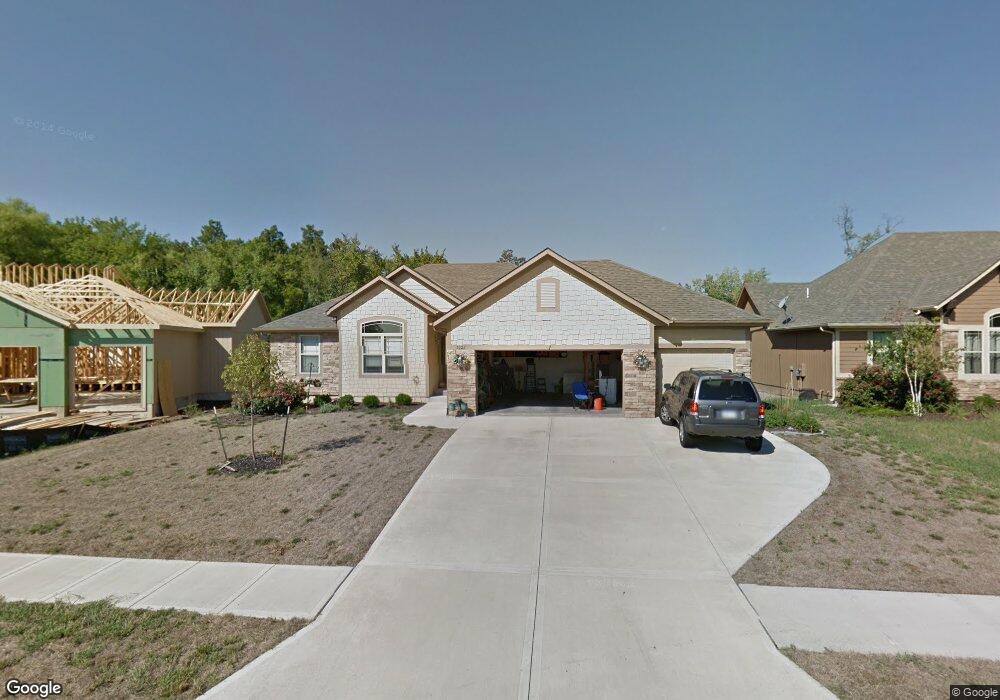
5022 Theden St Shawnee, KS 66218
Estimated Value: $507,233 - $534,000
4
Beds
3
Baths
1,665
Sq Ft
$312/Sq Ft
Est. Value
About This Home
This home is located at 5022 Theden St, Shawnee, KS 66218 and is currently estimated at $520,308, approximately $312 per square foot. 5022 Theden St is a home located in Johnson County with nearby schools including Riverview Elementary School, Mill Creek Middle School, and Mill Valley High School.
Ownership History
Date
Name
Owned For
Owner Type
Purchase Details
Closed on
Nov 26, 2019
Sold by
Roy Daniel C and Roy Denise M
Bought by
Roy Daniel C and Roy Denise M
Current Estimated Value
Purchase Details
Closed on
Jun 30, 2010
Sold by
Rw Investments Llc
Bought by
Roy Daniel C and Roy Denise M
Purchase Details
Closed on
Sep 4, 2009
Sold by
Peoples Bank
Bought by
Rw Investments Llc
Home Financials for this Owner
Home Financials are based on the most recent Mortgage that was taken out on this home.
Original Mortgage
$200,000
Interest Rate
5.26%
Mortgage Type
Construction
Purchase Details
Closed on
Jun 25, 2009
Sold by
American Woodland Properties
Bought by
Peoples Bank
Purchase Details
Closed on
May 1, 2009
Sold by
Woodland Properties
Bought by
Peoples Bank
Create a Home Valuation Report for This Property
The Home Valuation Report is an in-depth analysis detailing your home's value as well as a comparison with similar homes in the area
Home Values in the Area
Average Home Value in this Area
Purchase History
| Date | Buyer | Sale Price | Title Company |
|---|---|---|---|
| Roy Daniel C | -- | None Available | |
| Roy Daniel C | -- | Midwest Title Company Inc | |
| Rw Investments Llc | -- | Chicago Title Insurance Co | |
| Peoples Bank | $1,125,705 | None Available | |
| Peoples Bank | -- | None Available |
Source: Public Records
Mortgage History
| Date | Status | Borrower | Loan Amount |
|---|---|---|---|
| Previous Owner | Rw Investments Llc | $200,000 |
Source: Public Records
Tax History Compared to Growth
Tax History
| Year | Tax Paid | Tax Assessment Tax Assessment Total Assessment is a certain percentage of the fair market value that is determined by local assessors to be the total taxable value of land and additions on the property. | Land | Improvement |
|---|---|---|---|---|
| 2024 | $6,343 | $54,441 | $9,899 | $44,542 |
| 2023 | $5,939 | $50,496 | $9,899 | $40,597 |
| 2022 | $5,655 | $47,104 | $8,605 | $38,499 |
| 2021 | $5,123 | $41,044 | $7,811 | $33,233 |
| 2020 | $5,061 | $40,181 | $7,811 | $32,370 |
| 2019 | $4,802 | $37,559 | $7,896 | $29,663 |
| 2018 | $4,655 | $36,087 | $6,884 | $29,203 |
| 2017 | $4,521 | $34,190 | $6,884 | $27,306 |
| 2016 | $4,459 | $33,304 | $6,884 | $26,420 |
| 2015 | $4,372 | $32,085 | $6,884 | $25,201 |
| 2013 | -- | $30,464 | $6,884 | $23,580 |
Source: Public Records
Map
Nearby Homes
- 5015 Millbrook St
- 21408 W 50th St
- 21222 W 48th St
- 4754 Lakecrest Dr
- 21525 W 51st St
- 5311 Brownridge Dr
- 4713 Lone Elm
- 5405 Lakecrest Dr
- 5307 Noble St
- 4531 Woodstock St
- 21804 W 52nd Terrace
- 20823 W 45th Terrace
- 21624 W 53rd Terrace
- 5116 Payne St
- 22014 W 51st St
- 5206 Round Prairie St
- 21217 W 55th Terrace
- 22014 W 47th Terrace
- 22115 W 51st Terrace
- 21309 W 56th St
- 5018 Theden St
- 5026 Theden St
- 5014 Theden St
- 5021 Theden St
- 5030 Theden St
- 5017 Theden St
- 5055 Lakecrest Dr
- 5013 Theden St
- 5010 Theden St
- 5034 Theden St
- 5061 Lakecrest Dr
- 5033 Lakecrest Dr
- 5041 Woodstock Ct
- 5009 Theden St
- 5105 Lakecrest Dr
- 5038 Woodstock Ct
- 5111 Lakecrest Dr
- 21206 W 51st St
- 21205 W 50th Terrace
- 5037 Woodstock Ct