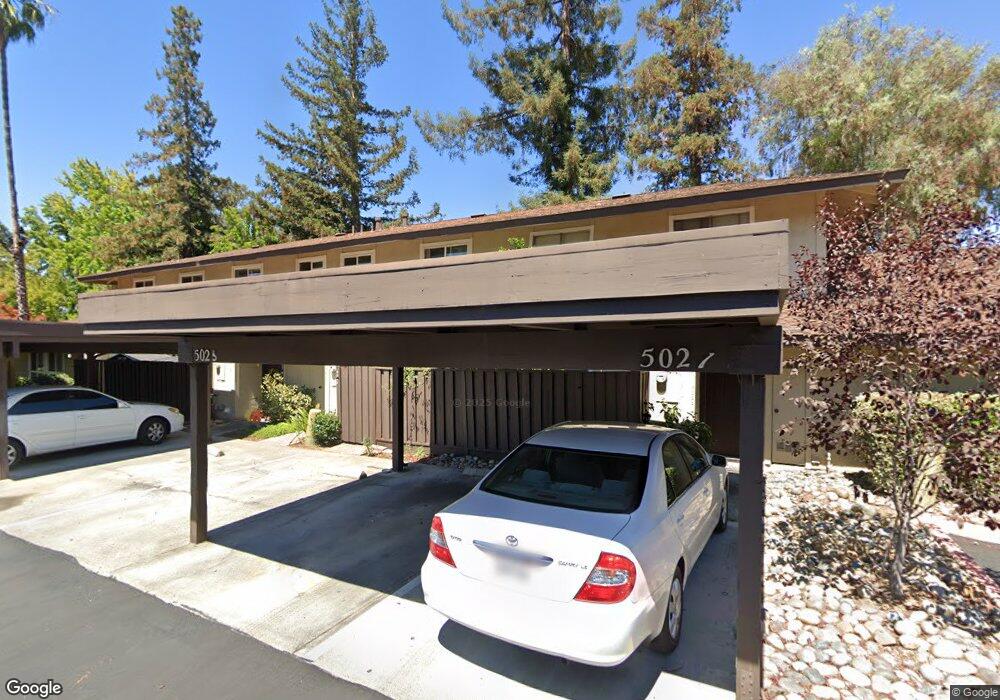
5025 Pinetree Trail San Jose, CA 95130
Westmont NeighborhoodEstimated Value: $804,000 - $1,205,000
2
Beds
2
Baths
970
Sq Ft
$971/Sq Ft
Est. Value
About This Home
This home is located at 5025 Pinetree Trail, San Jose, CA 95130 and is currently estimated at $942,124, approximately $971 per square foot. 5025 Pinetree Trail is a home located in Santa Clara County with nearby schools including Westmont High School, Forest Hill Elementary School, and Marshall Lane Elementary School.
Ownership History
Date
Name
Owned For
Owner Type
Purchase Details
Closed on
May 25, 2021
Sold by
Song Jing
Bought by
Upton Robert
Current Estimated Value
Purchase Details
Closed on
Jun 15, 2018
Sold by
Hsu Shan Ting
Bought by
Upton Robert
Home Financials for this Owner
Home Financials are based on the most recent Mortgage that was taken out on this home.
Original Mortgage
$672,000
Outstanding Balance
$581,167
Interest Rate
4.5%
Mortgage Type
New Conventional
Estimated Equity
$360,957
Purchase Details
Closed on
Aug 26, 2013
Sold by
Good Davonna L and Deffina Donell R
Bought by
Hsu Shan Ting
Home Financials for this Owner
Home Financials are based on the most recent Mortgage that was taken out on this home.
Original Mortgage
$320,000
Interest Rate
4.27%
Mortgage Type
New Conventional
Purchase Details
Closed on
Apr 22, 2004
Sold by
Good Davonna Louise
Bought by
Good Davonna L and Deffina Donell R
Create a Home Valuation Report for This Property
The Home Valuation Report is an in-depth analysis detailing your home's value as well as a comparison with similar homes in the area
Home Values in the Area
Average Home Value in this Area
Purchase History
| Date | Buyer | Sale Price | Title Company |
|---|---|---|---|
| Upton Robert | -- | None Available | |
| Upton Robert | $840,000 | First American Title Co | |
| Hsu Shan Ting | $400,000 | Old Republic Title Company | |
| Good Davonna L | -- | -- |
Source: Public Records
Mortgage History
| Date | Status | Borrower | Loan Amount |
|---|---|---|---|
| Open | Upton Robert | $672,000 | |
| Previous Owner | Hsu Shan Ting | $320,000 |
Source: Public Records
Tax History Compared to Growth
Tax History
| Year | Tax Paid | Tax Assessment Tax Assessment Total Assessment is a certain percentage of the fair market value that is determined by local assessors to be the total taxable value of land and additions on the property. | Land | Improvement |
|---|---|---|---|---|
| 2025 | $11,336 | $955,770 | $477,885 | $477,885 |
| 2024 | $11,336 | $870,000 | $435,000 | $435,000 |
| 2023 | $10,679 | $815,000 | $407,500 | $407,500 |
| 2022 | $11,777 | $900,646 | $450,323 | $450,323 |
| 2021 | $11,107 | $844,000 | $422,000 | $422,000 |
| 2020 | $10,855 | $833,000 | $416,500 | $416,500 |
| 2019 | $11,240 | $856,800 | $428,400 | $428,400 |
| 2018 | $5,977 | $430,944 | $215,472 | $215,472 |
| 2017 | $5,903 | $422,496 | $211,248 | $211,248 |
| 2016 | $5,569 | $414,212 | $207,106 | $207,106 |
| 2015 | $5,484 | $407,992 | $203,996 | $203,996 |
| 2014 | $5,300 | $400,000 | $200,000 | $200,000 |
Source: Public Records
Map
Nearby Homes
- 4994 Peach Terrace
- 4736 Westmont Ave
- 2510 Villanova Rd
- 1694 Hyde Dr
- 18732 Afton Ave
- 1901 La Corona Ct
- 142 Calle Larga
- 18677 Mccoy Ave
- 112 El Olivar
- 13446 Alvarado Ct
- 105 Callecita
- 2476 Le Bain Dr
- 2303 Camrose Ave
- 14001 Chester Ave
- 232 More Ave
- 13550 Myren Dr
- 5169 Bobbie Ave
- 12890 Lantana Ave
- 10330 Elm Cir Unit 12-03 Plan 2
- 107 Naramore Ln
- 5025 Pinetree Terrace
- 5025 Pine Tree Terrace
- 5027 Pine Tree Terrace
- 5027 Pinetree Trail
- 5023 Pine Tree Terrace
- 5029 Pinetree Terrace
- 5029 Pine Tree Terrace
- 5021 Pine Tree Terrace
- 5031 Pine Tree Terrace
- 5019 Pine Tree Terrace
- 5078 Pinetree Ct
- 5078 Pine Tree Terrace
- 5017 Pine Tree Terrace
- 5074 Pine Tree Terrace
- 5070 Pine Tree Terrace
- 5013 Pinetree Terrace
- 5066 Pine Tree Terrace
- 5015 Pine Tree Terrace
- 5020 Pine Tree Terrace
- 5003 Ponderosa Terrace