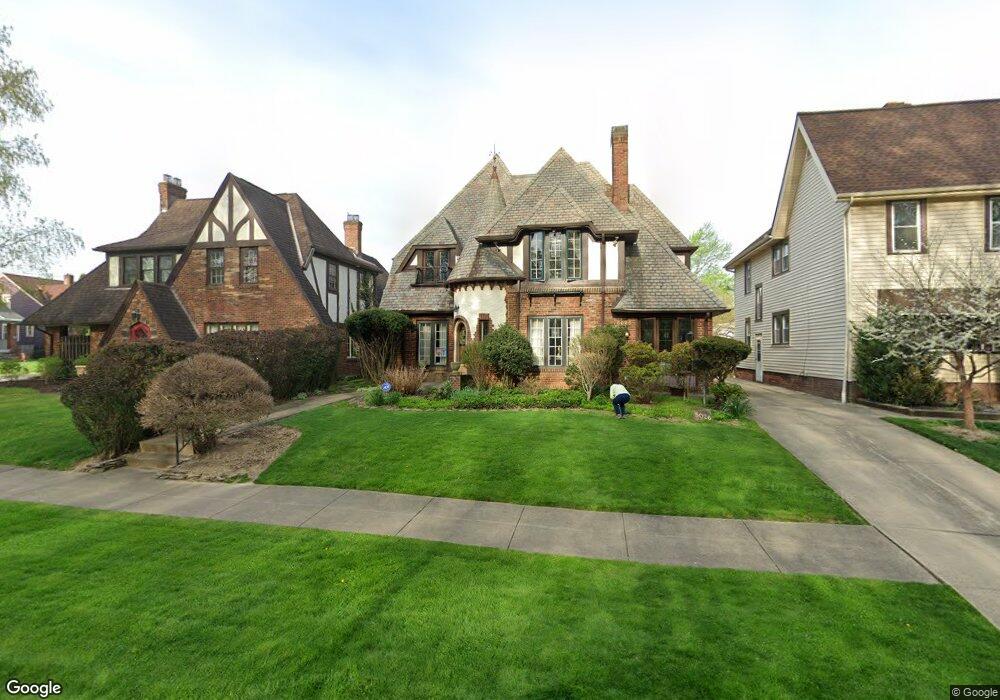
5026 Edgepark Dr Cleveland, OH 44125
Estimated Value: $182,000 - $236,185
3
Beds
2
Baths
2,174
Sq Ft
$99/Sq Ft
Est. Value
About This Home
This home is located at 5026 Edgepark Dr, Cleveland, OH 44125 and is currently estimated at $215,296, approximately $99 per square foot. 5026 Edgepark Dr is a home located in Cuyahoga County with nearby schools including Garfield Heights High School, SMART Academy, and North Shore High School.
Ownership History
Date
Name
Owned For
Owner Type
Purchase Details
Closed on
May 10, 2007
Sold by
Travis Bruce E
Bought by
Stemnock Robert B and Stemnock Lisa A
Current Estimated Value
Home Financials for this Owner
Home Financials are based on the most recent Mortgage that was taken out on this home.
Original Mortgage
$180,000
Outstanding Balance
$109,727
Interest Rate
6.21%
Mortgage Type
Purchase Money Mortgage
Estimated Equity
$105,569
Purchase Details
Closed on
Jan 8, 1993
Sold by
Long Benjamin E
Bought by
Travis Bruce E
Purchase Details
Closed on
Feb 27, 1986
Sold by
Levy Jerome
Bought by
Long Benjamin E
Purchase Details
Closed on
Jul 7, 1977
Sold by
Stanevich Frank and Stanevich Margaret
Bought by
Levy Jerome
Purchase Details
Closed on
Jan 1, 1975
Bought by
Stanevich Frank and Stanevich Margaret
Create a Home Valuation Report for This Property
The Home Valuation Report is an in-depth analysis detailing your home's value as well as a comparison with similar homes in the area
Home Values in the Area
Average Home Value in this Area
Purchase History
| Date | Buyer | Sale Price | Title Company |
|---|---|---|---|
| Stemnock Robert B | $180,000 | Executive Title Agency | |
| Travis Bruce E | $100,000 | -- | |
| Long Benjamin E | $67,900 | -- | |
| Levy Jerome | $53,000 | -- | |
| Stanevich Frank | -- | -- |
Source: Public Records
Mortgage History
| Date | Status | Borrower | Loan Amount |
|---|---|---|---|
| Open | Stemnock Robert B | $180,000 |
Source: Public Records
Tax History Compared to Growth
Tax History
| Year | Tax Paid | Tax Assessment Tax Assessment Total Assessment is a certain percentage of the fair market value that is determined by local assessors to be the total taxable value of land and additions on the property. | Land | Improvement |
|---|---|---|---|---|
| 2024 | $8,375 | $85,085 | $9,975 | $75,110 |
| 2023 | $5,329 | $49,570 | $6,480 | $43,090 |
| 2022 | $5,262 | $49,560 | $6,480 | $43,090 |
| 2021 | $5,570 | $49,560 | $6,480 | $43,090 |
| 2020 | $4,763 | $39,660 | $5,180 | $34,480 |
| 2019 | $4,719 | $113,300 | $14,800 | $98,500 |
| 2018 | $4,931 | $39,660 | $5,180 | $34,480 |
| 2017 | $4,598 | $36,060 | $4,450 | $31,610 |
| 2016 | $4,667 | $36,060 | $4,450 | $31,610 |
| 2015 | $4,618 | $36,060 | $4,450 | $31,610 |
| 2014 | $4,618 | $39,200 | $4,830 | $34,370 |
Source: Public Records
Map
Nearby Homes
- 11105 Vernon Ave
- 11206 Park Heights Ave
- 11215 Langton Ave
- 11209 Langton Ave
- 11016 Mccracken Rd
- 11006 Mccracken Rd
- 10916 Mccracken Rd
- 10718 Vernon Ave
- 4935 E 109th St
- 5139 E 114th St
- 10717 Park Heights Ave
- 4909 E 110th St
- 11100 Wallingford Ave
- 4948 E 107th St
- 10609 Mccracken Blvd
- 4953 E 106th St
- 5204 Turney Rd
- 10506 Park Heights Ave
- 4885 E 107th St
- 10501 Park Heights Ave
- 5020 Edgepark Dr
- 5032 Edgepark Dr
- 11313 Plymouth Ave
- 5016 Edgepark Dr
- 11310 Vernon Ave
- 11305 Plymouth Ave
- 11218 Vernon Ave
- 11318 Plymouth Ave
- 11227 Plymouth Ave
- 11320 Plymouth Ave
- 11314 Plymouth Ave
- 11214 Vernon Ave
- 11310 Plymouth Ave
- 5010 Edgepark Dr
- 11306 Plymouth Ave
- 11215 Plymouth Ave
- 11210 Vernon Ave
- 11219 Vernon Ave
- 11404 Edgepark Dr
- 5002 Edgepark Dr