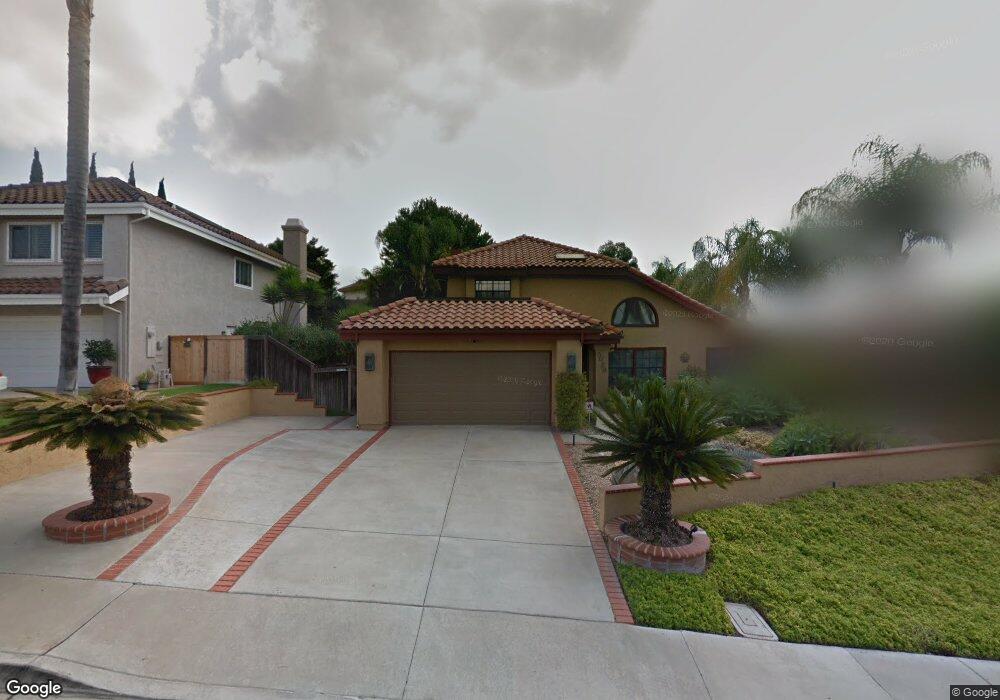
5029 Alejo St San Diego, CA 92124
Tierrasanta NeighborhoodEstimated Value: $1,524,000 - $1,843,000
4
Beds
3
Baths
2,479
Sq Ft
$662/Sq Ft
Est. Value
About This Home
This home is located at 5029 Alejo St, San Diego, CA 92124 and is currently estimated at $1,641,763, approximately $662 per square foot. 5029 Alejo St is a home located in San Diego County with nearby schools including Kumeyaay Elementary School, De Portola Middle School, and Farb Middle School.
Ownership History
Date
Name
Owned For
Owner Type
Purchase Details
Closed on
Dec 15, 2020
Sold by
Quitmeyer Scott P and Quitmeyer Susan R
Bought by
Quitmeyer Scott P and Quitmeyer Susan R
Current Estimated Value
Purchase Details
Closed on
Mar 15, 2017
Sold by
Corder Angelica M
Bought by
Quitmeyer Scott P and Quitmeyer Sue
Home Financials for this Owner
Home Financials are based on the most recent Mortgage that was taken out on this home.
Original Mortgage
$604,000
Outstanding Balance
$499,892
Interest Rate
4.1%
Mortgage Type
New Conventional
Estimated Equity
$1,141,871
Purchase Details
Closed on
Feb 25, 2000
Sold by
Corder Sidney V
Bought by
Corder Angelica M
Purchase Details
Closed on
Mar 10, 1998
Sold by
Humble Mary A
Bought by
Corder Sidney and Corder Angelica M
Purchase Details
Closed on
Oct 28, 1986
Purchase Details
Closed on
Dec 28, 1984
Create a Home Valuation Report for This Property
The Home Valuation Report is an in-depth analysis detailing your home's value as well as a comparison with similar homes in the area
Home Values in the Area
Average Home Value in this Area
Purchase History
| Date | Buyer | Sale Price | Title Company |
|---|---|---|---|
| Quitmeyer Scott P | -- | None Available | |
| Quitmeyer Scott P | $839,000 | Fidelity Natl Title Sd | |
| Corder Angelica M | -- | Fidelity National Title | |
| Corder Angelica M | -- | -- | |
| Corder Sidney | $371,000 | Fidelity National Title | |
| -- | $220,000 | -- | |
| -- | $179,000 | -- |
Source: Public Records
Mortgage History
| Date | Status | Borrower | Loan Amount |
|---|---|---|---|
| Open | Quitmeyer Scott P | $604,000 |
Source: Public Records
Tax History Compared to Growth
Tax History
| Year | Tax Paid | Tax Assessment Tax Assessment Total Assessment is a certain percentage of the fair market value that is determined by local assessors to be the total taxable value of land and additions on the property. | Land | Improvement |
|---|---|---|---|---|
| 2025 | $11,773 | $973,723 | $331,935 | $641,788 |
| 2024 | $11,773 | $954,631 | $325,427 | $629,204 |
| 2023 | $11,509 | $935,914 | $319,047 | $616,867 |
| 2022 | $11,198 | $917,564 | $312,792 | $604,772 |
| 2021 | $11,115 | $899,573 | $306,659 | $592,914 |
| 2020 | $10,979 | $890,350 | $303,515 | $586,835 |
| 2019 | $10,782 | $872,893 | $297,564 | $575,329 |
| 2018 | $10,080 | $855,779 | $291,730 | $564,049 |
| 2017 | $81 | $510,419 | $173,999 | $336,420 |
| 2016 | $5,898 | $500,412 | $170,588 | $329,824 |
| 2015 | $5,810 | $492,896 | $168,026 | $324,870 |
| 2014 | $5,717 | $483,242 | $164,735 | $318,507 |
Source: Public Records
Map
Nearby Homes
- 4755 Mayita Way
- 4989 Corte Playa Encino
- 11350 Camino Playa Cancun Unit 3
- 5238 Camino Playa Malaga
- 11370 Camino Playa Cancun Unit 3
- 10908 Avenida Playa Veracruz
- 4375 Calle de Vida
- 11136 Portobelo Dr
- 11116 Portobelo Dr
- 11048 Portobelo Dr
- 11056 Portobelo Dr
- 11080 Portobelo Dr
- 11086 Portobelo Dr Unit 125
- 6161 Calle Mariselda Unit 408
- 10834 Caravelle Place
- 10828 Lamentin Ct Unit 313
- 10889 Lamentin Ct
- 10812 Lamentin Ct Unit 312
- 6140 Calle Mariselda Unit 102
- 5137 Abuela Dr