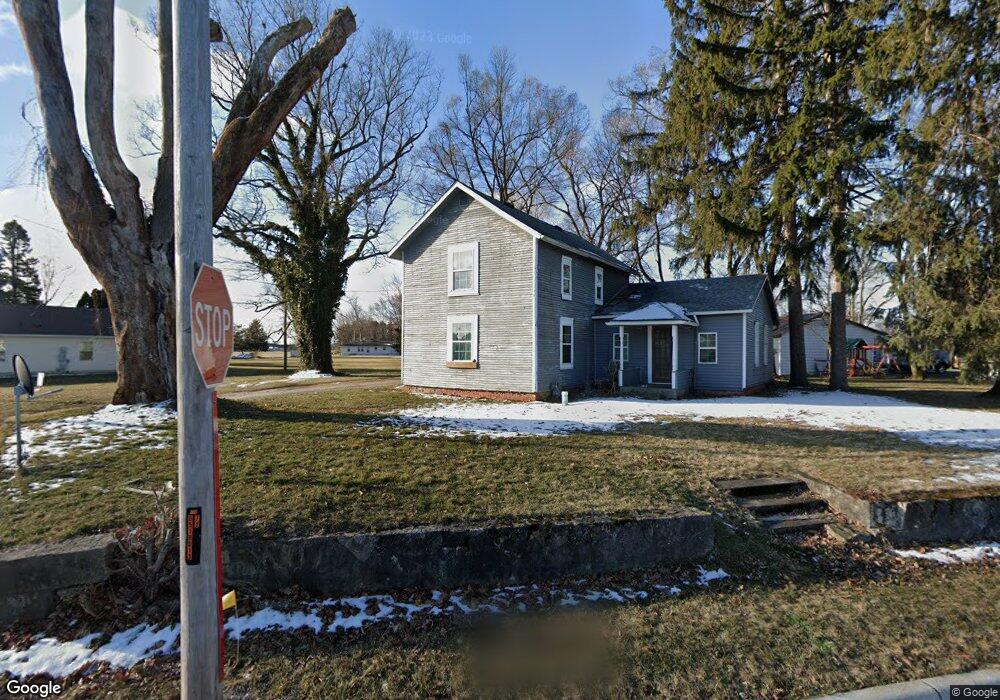
503 Appian Ave Napoleon, OH 43545
Estimated Value: $153,186 - $201,000
5
Beds
2
Baths
1,639
Sq Ft
$105/Sq Ft
Est. Value
About This Home
This home is located at 503 Appian Ave, Napoleon, OH 43545 and is currently estimated at $171,297, approximately $104 per square foot. 503 Appian Ave is a home located in Henry County with nearby schools including Napoleon Elementary School, Napoleon Junior/Senior High School, and St. Augustine School.
Ownership History
Date
Name
Owned For
Owner Type
Purchase Details
Closed on
Feb 12, 2010
Sold by
Fruchey Keith A
Bought by
Fruchey Brian K
Current Estimated Value
Home Financials for this Owner
Home Financials are based on the most recent Mortgage that was taken out on this home.
Original Mortgage
$64,000
Outstanding Balance
$42,716
Interest Rate
5.2%
Mortgage Type
New Conventional
Estimated Equity
$128,581
Purchase Details
Closed on
Oct 15, 2009
Sold by
Fannie Mae
Bought by
Fruchey Keith A
Purchase Details
Closed on
Jul 16, 2009
Sold by
Cole Jolynn K
Bought by
Federal National Mortgage Association
Purchase Details
Closed on
Jun 21, 2007
Sold by
Meyers Ronald R and Meyers Donnalee I
Bought by
Cole Jolynn K
Home Financials for this Owner
Home Financials are based on the most recent Mortgage that was taken out on this home.
Original Mortgage
$57,000
Interest Rate
6.2%
Mortgage Type
Purchase Money Mortgage
Create a Home Valuation Report for This Property
The Home Valuation Report is an in-depth analysis detailing your home's value as well as a comparison with similar homes in the area
Home Values in the Area
Average Home Value in this Area
Purchase History
| Date | Buyer | Sale Price | Title Company |
|---|---|---|---|
| Fruchey Brian K | $80,000 | Attorney | |
| Fruchey Keith A | $18,000 | Accutitle Agency Inc | |
| Federal National Mortgage Association | $22,000 | None Available | |
| Cole Jolynn K | $57,000 | Attorney |
Source: Public Records
Mortgage History
| Date | Status | Borrower | Loan Amount |
|---|---|---|---|
| Open | Fruchey Brian K | $64,000 | |
| Previous Owner | Cole Jolynn K | $57,000 |
Source: Public Records
Tax History Compared to Growth
Tax History
| Year | Tax Paid | Tax Assessment Tax Assessment Total Assessment is a certain percentage of the fair market value that is determined by local assessors to be the total taxable value of land and additions on the property. | Land | Improvement |
|---|---|---|---|---|
| 2024 | $1,930 | $45,610 | $6,110 | $39,500 |
| 2023 | $1,930 | $45,610 | $6,110 | $39,500 |
| 2022 | $1,267 | $55,280 | $7,640 | $47,640 |
| 2021 | $1,267 | $27,640 | $3,820 | $23,820 |
| 2020 | $1,333 | $27,640 | $3,820 | $23,820 |
| 2019 | $1,174 | $23,610 | $3,570 | $20,040 |
| 2018 | $1,146 | $23,610 | $3,570 | $20,040 |
| 2017 | $1,103 | $23,610 | $3,570 | $20,040 |
| 2016 | $1,116 | $23,200 | $3,570 | $19,630 |
| 2015 | $1,097 | $23,200 | $3,570 | $19,630 |
| 2014 | $1,209 | $23,200 | $3,570 | $19,630 |
| 2013 | $1,209 | $23,810 | $3,570 | $20,240 |
Source: Public Records
Map
Nearby Homes
- 455 Oxford St
- 445 Oxford St
- 635 Beckham St
- 465 Oxford St
- 701 S Perry St
- 433 E Main St
- 111 & 113 Yeager St
- M727 17-D
- 948 Dagget Dr
- 424 E Clinton St
- 413 Fillmore St
- 551 W Main St
- 342 W Clinton St
- 432 W Clinton St
- 108 Yeager St
- 1081 Scott St
- 725 Sheffield Ave
- 825 Old School Dr
- 816 W Washington St
- 1122 Ohio St