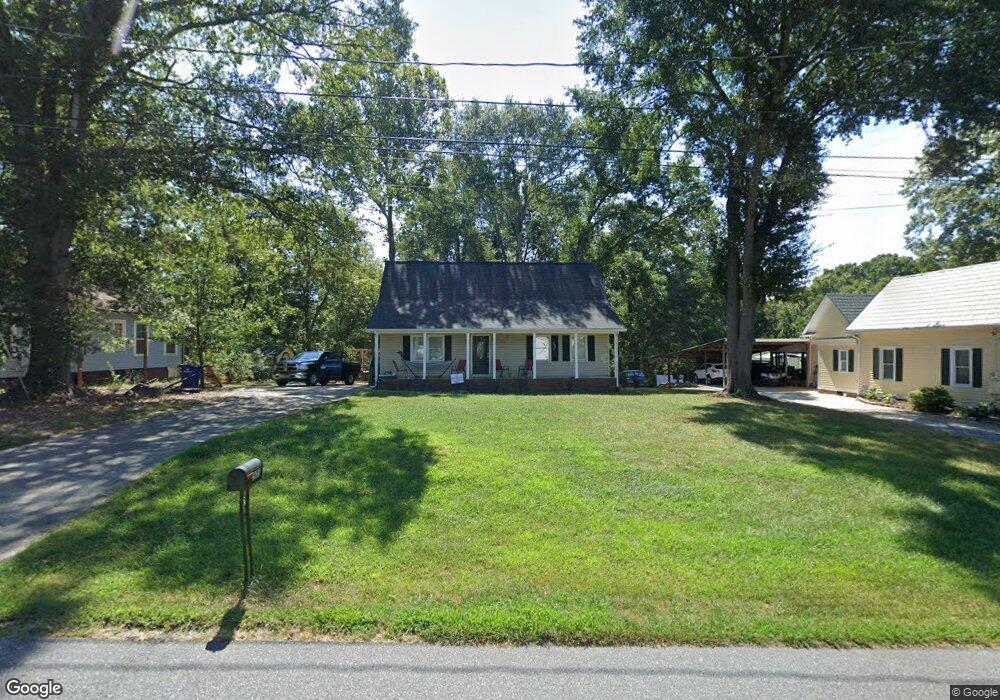
503 Bonview Ave Lincolnton, NC 28092
Estimated Value: $300,360 - $331,000
3
Beds
3
Baths
1,638
Sq Ft
$196/Sq Ft
Est. Value
About This Home
This home is located at 503 Bonview Ave, Lincolnton, NC 28092 and is currently estimated at $320,340, approximately $195 per square foot. 503 Bonview Ave is a home located in Lincoln County with nearby schools including Battleground Elementary School, Lincolnton Middle School, and Lincolnton High School.
Ownership History
Date
Name
Owned For
Owner Type
Purchase Details
Closed on
Dec 9, 2020
Sold by
Rhyne James and Rhyne Nancy
Bought by
Jovaneli Daniel H and Jovaneli Dora S
Current Estimated Value
Home Financials for this Owner
Home Financials are based on the most recent Mortgage that was taken out on this home.
Original Mortgage
$192,000
Outstanding Balance
$171,242
Interest Rate
2.8%
Mortgage Type
New Conventional
Estimated Equity
$149,098
Purchase Details
Closed on
May 14, 2020
Sold by
Weaver John W
Bought by
Rhyne James and Rhyne Nancy
Home Financials for this Owner
Home Financials are based on the most recent Mortgage that was taken out on this home.
Original Mortgage
$105,000
Interest Rate
3.1%
Mortgage Type
New Conventional
Purchase Details
Closed on
Aug 10, 1995
Bought by
Weaver John W
Purchase Details
Closed on
Apr 14, 1994
Bought by
Norman Jerry A and Norman Dana D
Purchase Details
Closed on
Jun 23, 1993
Bought by
Dean Floyd
Create a Home Valuation Report for This Property
The Home Valuation Report is an in-depth analysis detailing your home's value as well as a comparison with similar homes in the area
Purchase History
| Date | Buyer | Sale Price | Title Company |
|---|---|---|---|
| Jovaneli Daniel H | $240,000 | None Available | |
| Rhyne James | $115,000 | None Available | |
| Weaver John W | $91,000 | -- | |
| Norman Jerry A | $9,500 | -- | |
| Dean Floyd | $8,000 | -- |
Source: Public Records
Mortgage History
| Date | Status | Borrower | Loan Amount |
|---|---|---|---|
| Open | Jovaneli Daniel H | $192,000 | |
| Previous Owner | Rhyne James | $105,000 |
Source: Public Records
Tax History
| Year | Tax Paid | Tax Assessment Tax Assessment Total Assessment is a certain percentage of the fair market value that is determined by local assessors to be the total taxable value of land and additions on the property. | Land | Improvement |
|---|---|---|---|---|
| 2025 | $2,839 | $270,199 | $27,000 | $243,199 |
| 2024 | $2,819 | $270,199 | $27,000 | $243,199 |
| 2023 | $2,814 | $270,199 | $27,000 | $243,199 |
| 2022 | $1,786 | $141,750 | $18,000 | $123,750 |
| 2021 | $1,786 | $124,875 | $18,000 | $106,875 |
| 2020 | $1,447 | $124,875 | $18,000 | $106,875 |
| 2019 | $1,447 | $124,875 | $18,000 | $106,875 |
| 2018 | $1,484 | $118,123 | $17,500 | $100,623 |
| 2017 | $1,383 | $118,123 | $17,500 | $100,623 |
| 2016 | $1,383 | $118,123 | $17,500 | $100,623 |
| 2015 | $1,442 | $118,123 | $17,500 | $100,623 |
| 2014 | $1,459 | $118,889 | $18,500 | $100,389 |
Source: Public Records
Map
Nearby Homes
- Lot 2 Louise Ave
- Lot 3 Louise Ave
- Lot 1 Louise Ave
- 411 W Sycamore St
- 308 W Sycamore St
- 329 W Main St
- 801 N Grove St
- 606 Childs St
- 668 Riverside Dr
- 513 Grier St
- 4108 Summey Trail
- 335 E Sumner St
- 835 Sagefield Ct
- 331 S Laurel St
- 711 N Oak St
- 413 S Laurel St
- 1074 Better Brook Ln
- 000 Better Brook Ln
- 608 N State St
- 906 N Flint St
- 429 Bonview Ave
- 507 Bonview Ave
- 425 Bonview Ave
- 513 Bonview Ave
- 501 Forney Ave
- 506 W Pine St
- 419 Bonview Ave
- 305 Forney Ave
- 519 Bonview Ave
- 511 Forney Ave
- 518 W Pine St
- 440B Roberta Ave Unit A
- 440B Roberta Ave
- 440B Roberta Ave Unit B
- 440 Roberta Ave Unit A
- 440A Roberta Ave
- 520 Bonview Ave
- 420 Bonview Ave
- 523 Bonview Ave
- 303 Forney Ave
Your Personal Tour Guide
Ask me questions while you tour the home.