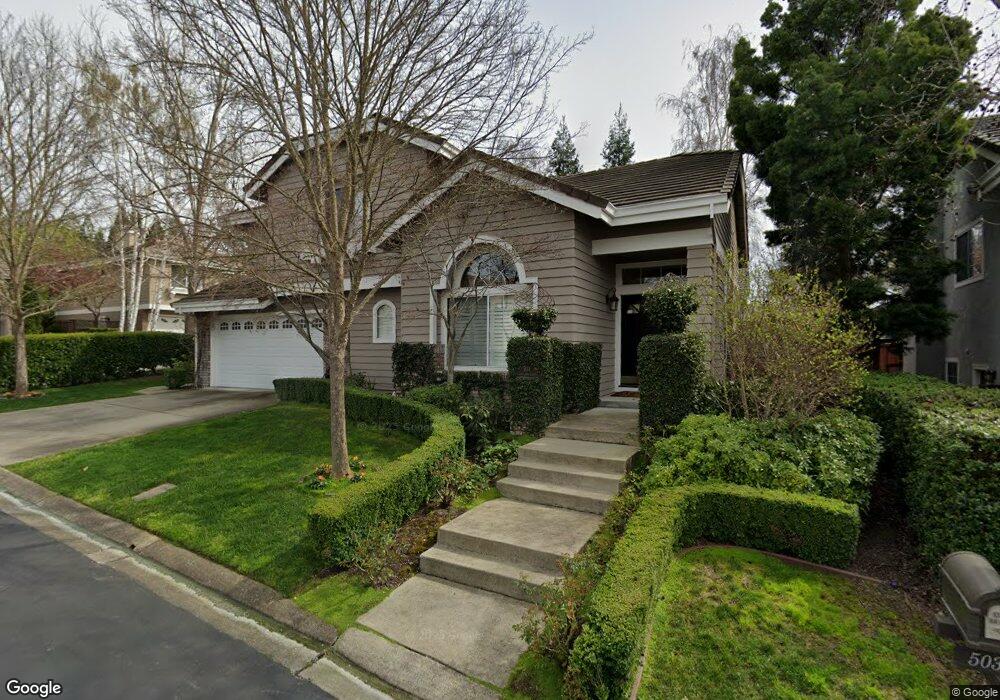
503 Chatelaine Ct Danville, CA 94506
Sycamore Valley NeighborhoodEstimated Value: $1,497,000 - $1,870,000
3
Beds
3
Baths
2,292
Sq Ft
$752/Sq Ft
Est. Value
About This Home
This home is located at 503 Chatelaine Ct, Danville, CA 94506 and is currently estimated at $1,723,869, approximately $752 per square foot. 503 Chatelaine Ct is a home located in Contra Costa County with nearby schools including Sycamore Valley Elementary School, Charlotte Wood Middle School, and San Ramon Valley High School.
Ownership History
Date
Name
Owned For
Owner Type
Purchase Details
Closed on
Sep 27, 2018
Sold by
Valente Mark and Valente Tiffany
Bought by
Valente Mark A and Valente Tiffany A
Current Estimated Value
Purchase Details
Closed on
Dec 28, 2011
Sold by
Valente Mark and Valente Tiffany
Bought by
Valente Mark and Valente Tiffany
Home Financials for this Owner
Home Financials are based on the most recent Mortgage that was taken out on this home.
Original Mortgage
$409,500
Outstanding Balance
$35,418
Interest Rate
3.93%
Mortgage Type
New Conventional
Estimated Equity
$1,688,451
Purchase Details
Closed on
Oct 12, 1993
Sold by
Ahmanson Residential Development
Bought by
Valente Mark A and Valente Tiffany A
Home Financials for this Owner
Home Financials are based on the most recent Mortgage that was taken out on this home.
Original Mortgage
$295,800
Interest Rate
6.95%
Mortgage Type
Purchase Money Mortgage
Create a Home Valuation Report for This Property
The Home Valuation Report is an in-depth analysis detailing your home's value as well as a comparison with similar homes in the area
Home Values in the Area
Average Home Value in this Area
Purchase History
| Date | Buyer | Sale Price | Title Company |
|---|---|---|---|
| Valente Mark A | -- | None Available | |
| Valente Mark | -- | Placer Title Company | |
| Valente Mark A | $370,000 | First American Title Co |
Source: Public Records
Mortgage History
| Date | Status | Borrower | Loan Amount |
|---|---|---|---|
| Open | Valente Mark | $409,500 | |
| Closed | Valente Mark A | $295,800 |
Source: Public Records
Tax History
| Year | Tax Paid | Tax Assessment Tax Assessment Total Assessment is a certain percentage of the fair market value that is determined by local assessors to be the total taxable value of land and additions on the property. | Land | Improvement |
|---|---|---|---|---|
| 2025 | $7,946 | $628,351 | $267,688 | $360,663 |
| 2024 | $7,640 | $616,032 | $262,440 | $353,592 |
| 2023 | $7,640 | $603,954 | $257,295 | $346,659 |
| 2022 | $7,584 | $592,112 | $252,250 | $339,862 |
| 2021 | $7,419 | $580,503 | $247,304 | $333,199 |
| 2019 | $7,249 | $563,287 | $239,970 | $323,317 |
| 2018 | $6,985 | $552,243 | $235,265 | $316,978 |
| 2017 | $6,734 | $541,415 | $230,652 | $310,763 |
| 2016 | $6,639 | $530,800 | $226,130 | $304,670 |
| 2015 | $6,548 | $522,828 | $222,734 | $300,094 |
| 2014 | $6,453 | $512,587 | $218,371 | $294,216 |
Source: Public Records
Map
Nearby Homes
- 3652 Old Blackhawk Rd
- 525 Silver Oak Ln
- 101 Victoria Place
- 4060 Sugar Maple Dr
- 4053 Sugar Maple Dr
- 6401 Camino Tassajara
- 55 Marseille Ct
- 4345 Conejo Dr
- 6020 Condor St
- 313 Camino Arroyo E
- 222 Portola Dr
- 10 Crown Valley Ct
- 509 Zenith Ridge Dr
- 35 Sierra Ridge Ct
- 2860 Camino Tassajara
- 246 Stetson Dr
- 121 Rassani Dr
- 551 Blackhawk Club Dr
- 25 Westbourne Ct
- 300 Bridgeside Cir
- 501 Chatelaine Ct
- 302 Bonaire Ct
- 505 Chatelaine Ct
- 507 Chatelaine Ct
- 500 Chatelaine Ct
- 304 Bonaire Ct
- 506 Chatelaine Ct
- 502 Chatelaine Ct
- 306 Bonaire Ct
- 601 Ambience Way
- 1031 Belleterre Dr
- 301 Bonaire Ct
- 1033 Belleterre Dr
- 504 Chatelaine Ct
- 303 Bonaire Ct
- 603 Ambience Way
- 1035 Belleterre Dr
- 401 Triomphe Ct
- 305 Bonaire Ct
- 1037 Belleterre Dr
Your Personal Tour Guide
Ask me questions while you tour the home.