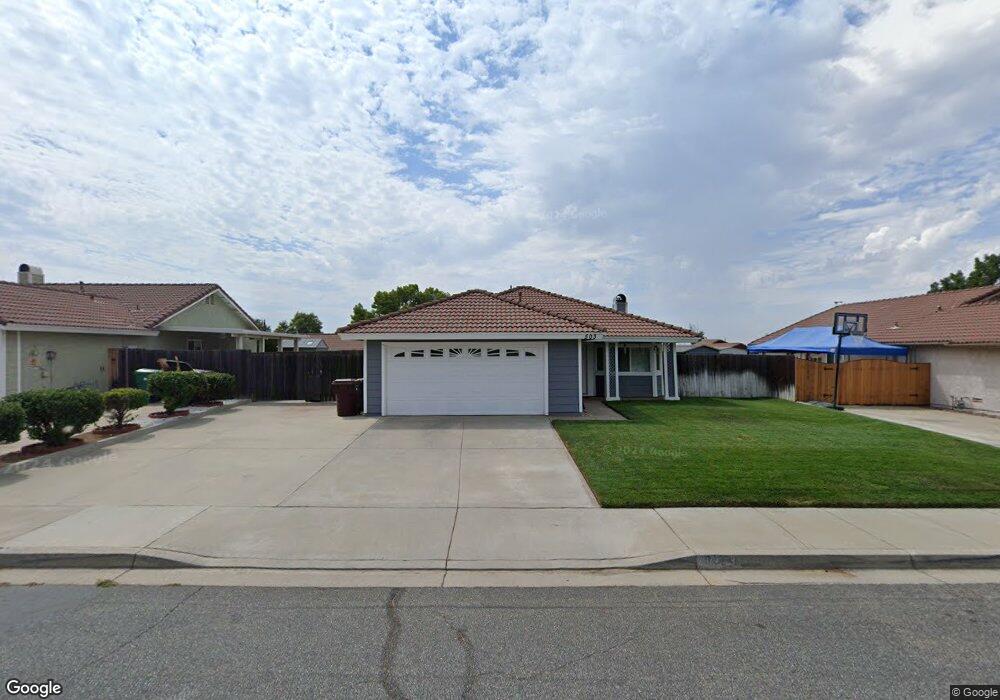
503 Cynthia St Beaumont, CA 92223
Estimated Value: $429,799 - $442,000
3
Beds
2
Baths
1,103
Sq Ft
$397/Sq Ft
Est. Value
About This Home
This home is located at 503 Cynthia St, Beaumont, CA 92223 and is currently estimated at $437,450, approximately $396 per square foot. 503 Cynthia St is a home located in Riverside County with nearby schools including Starlight Elementary School, San Gorgonio Middle School, and Beaumont Senior High School.
Ownership History
Date
Name
Owned For
Owner Type
Purchase Details
Closed on
Feb 9, 2021
Sold by
Werblak Jeffrey and Werblak Lorrie
Bought by
Werblak Lorrie and Werblak Jeffrey
Current Estimated Value
Purchase Details
Closed on
Nov 6, 2015
Sold by
Werblak Jeffrey and Werblak Lorrie
Bought by
Werblak Jeffrey and Werblak Lorrie
Home Financials for this Owner
Home Financials are based on the most recent Mortgage that was taken out on this home.
Original Mortgage
$202,380
Outstanding Balance
$160,255
Interest Rate
3.99%
Mortgage Type
FHA
Estimated Equity
$277,195
Purchase Details
Closed on
Jun 14, 1999
Sold by
Georgen Robert D and Georgen Mara S
Bought by
Werblak Jeffrey F and Werblak Lorrie
Home Financials for this Owner
Home Financials are based on the most recent Mortgage that was taken out on this home.
Original Mortgage
$84,869
Interest Rate
7.24%
Mortgage Type
FHA
Create a Home Valuation Report for This Property
The Home Valuation Report is an in-depth analysis detailing your home's value as well as a comparison with similar homes in the area
Home Values in the Area
Average Home Value in this Area
Purchase History
| Date | Buyer | Sale Price | Title Company |
|---|---|---|---|
| Werblak Lorrie | -- | None Available | |
| Werblak Jeffrey | -- | Chicago Title Company | |
| Werblak Jeffrey F | $85,000 | Gateway Title Company |
Source: Public Records
Mortgage History
| Date | Status | Borrower | Loan Amount |
|---|---|---|---|
| Open | Werblak Jeffrey | $202,380 | |
| Closed | Werblak Jeffrey F | $84,869 |
Source: Public Records
Tax History Compared to Growth
Tax History
| Year | Tax Paid | Tax Assessment Tax Assessment Total Assessment is a certain percentage of the fair market value that is determined by local assessors to be the total taxable value of land and additions on the property. | Land | Improvement |
|---|---|---|---|---|
| 2025 | $1,724 | $130,609 | $46,093 | $84,516 |
| 2023 | $1,724 | $125,539 | $44,304 | $81,235 |
| 2022 | $1,699 | $123,079 | $43,436 | $79,643 |
| 2021 | $1,667 | $120,667 | $42,585 | $78,082 |
| 2020 | $1,648 | $119,431 | $42,149 | $77,282 |
| 2019 | $1,623 | $117,090 | $41,323 | $75,767 |
| 2018 | $1,616 | $114,795 | $40,514 | $74,281 |
| 2017 | $1,590 | $112,545 | $39,720 | $72,825 |
| 2016 | $1,548 | $110,340 | $38,942 | $71,398 |
| 2015 | $1,523 | $108,685 | $38,358 | $70,327 |
| 2014 | $1,524 | $106,557 | $37,607 | $68,950 |
Source: Public Records
Map
Nearby Homes
- 601 Cypress St
- 645 Bryce Ln
- 717 Lions Lair Rd
- 1679 Stone Creek Rd
- 1657 Stone Creek Rd
- 1626 Stone Creek Rd
- 1601 Stone Creek Rd
- 1627 Quail Summit Dr
- 1595 Mountain View Trail
- 11345 Sunnyslope Ave
- 1123 Brown Bear Trail
- 10956 Cherry Ave
- 11285 Cherry Ave
- 1322 Melstone St
- 39060 Cherry Valley Blvd Unit 65
- 10596 El Monte Dr
- 0 Cherry Valley Blvd Unit OC25041579
- 10325 Live Oak Ave
- 687 Cedar View Dr
- 1661 Milford Way