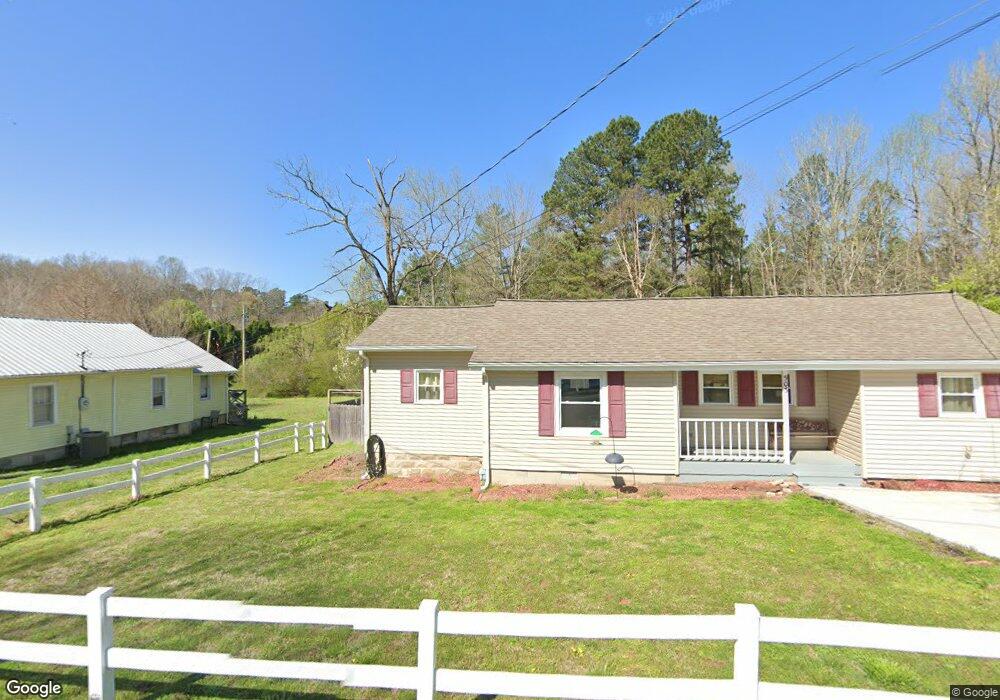
503 Dykeman Rd Dickson, TN 37055
Estimated Value: $231,899 - $295,000
--
Bed
1
Bath
1,155
Sq Ft
$227/Sq Ft
Est. Value
About This Home
This home is located at 503 Dykeman Rd, Dickson, TN 37055 and is currently estimated at $261,725, approximately $226 per square foot. 503 Dykeman Rd is a home located in Dickson County with nearby schools including Centennial Elementary School, Dickson Middle School, and Dickson County High School.
Ownership History
Date
Name
Owned For
Owner Type
Purchase Details
Closed on
Aug 28, 2013
Sold by
Richardson Julie
Bought by
Cantrell Vivian C
Current Estimated Value
Home Financials for this Owner
Home Financials are based on the most recent Mortgage that was taken out on this home.
Original Mortgage
$76,000
Outstanding Balance
$56,473
Interest Rate
4.37%
Mortgage Type
Commercial
Estimated Equity
$205,252
Purchase Details
Closed on
Jun 9, 2004
Sold by
Lamar Magenheimer Trust
Bought by
Knight Julie
Home Financials for this Owner
Home Financials are based on the most recent Mortgage that was taken out on this home.
Original Mortgage
$86,000
Interest Rate
5.36%
Purchase Details
Closed on
Jun 23, 2003
Sold by
Lamar Bonnie H
Bought by
Lamar Bonnie J
Purchase Details
Closed on
Apr 15, 1994
Sold by
Armstrong Betty
Bought by
Lamar Bonnie
Purchase Details
Closed on
Dec 27, 1984
Bought by
Armstrong Osbie H L and Armstrong E
Purchase Details
Closed on
Oct 10, 1980
Bought by
Armstrong Osbie H
Create a Home Valuation Report for This Property
The Home Valuation Report is an in-depth analysis detailing your home's value as well as a comparison with similar homes in the area
Home Values in the Area
Average Home Value in this Area
Purchase History
| Date | Buyer | Sale Price | Title Company |
|---|---|---|---|
| Cantrell Vivian C | $95,000 | -- | |
| Knight Julie | $75,000 | -- | |
| Lamar Bonnie J | -- | -- | |
| Lamar Bonnie | -- | -- | |
| Lamar Bonnie H | $30,000 | -- | |
| Armstrong Osbie H L | $23,500 | -- | |
| Armstrong Osbie H | -- | -- |
Source: Public Records
Mortgage History
| Date | Status | Borrower | Loan Amount |
|---|---|---|---|
| Open | Cantrell Vivian C | $76,000 | |
| Previous Owner | Armstrong Osbie H | $86,000 |
Source: Public Records
Tax History Compared to Growth
Tax History
| Year | Tax Paid | Tax Assessment Tax Assessment Total Assessment is a certain percentage of the fair market value that is determined by local assessors to be the total taxable value of land and additions on the property. | Land | Improvement |
|---|---|---|---|---|
| 2025 | -- | $39,475 | $0 | $0 |
| 2024 | $873 | $39,475 | $8,475 | $31,000 |
| 2023 | $873 | $27,975 | $4,175 | $23,800 |
| 2022 | $873 | $27,975 | $4,175 | $23,800 |
| 2021 | $873 | $27,975 | $4,175 | $23,800 |
| 2020 | $873 | $27,975 | $4,175 | $23,800 |
| 2019 | $873 | $27,975 | $4,175 | $23,800 |
| 2018 | $715 | $19,575 | $3,825 | $15,750 |
| 2017 | $715 | $19,575 | $3,825 | $15,750 |
| 2016 | $715 | $19,575 | $3,825 | $15,750 |
| 2015 | $680 | $17,525 | $3,825 | $13,700 |
| 2014 | $665 | $17,150 | $3,825 | $13,325 |
Source: Public Records
Map
Nearby Homes
- 404 Masters Way
- 205 Oak Dr
- 500 Country Club Dr
- 2 Old Pond Ln
- 4 Old Pond Ln
- 3 Old Pond Ln
- 119 Oak Dr
- 122 Pond Rd
- 435 Old Pond Ln
- 213 Mccreary Heights
- 445 Old Pond Ln
- 909 W 1st St
- 471 Old Pond Ln
- 210 Hardin Ave
- 0 Hardin Ave
- 444 Old Pond Ln
- 1105 N Charlotte St
- 414 W College St
- 110 Mccreary Heights
- 109 Brook Dr
- 501 Dykeman Rd
- 505 Dykeman Rd
- 411 Dykeman Rd
- 509 Dykeman Rd
- 0 Dykeman Rd
- 415 Dykeman Rd
- 601 Dykeman Rd
- 603 Dykeman Rd
- 600 Dykeman Rd
- 410 Dykeman Rd
- 0 Dykeman Road (Tract 2) Unit RTC2475567
- 0 Dykeman Road (Tract 2) Unit RTC2445643
- 602 Dykeman Rd
- 609 Dykeman Rd
- 610 Dykeman Rd
- 611 Dykeman Rd
- 711 Henslee Dr
- 701 Dykeman Rd
- 612.5 Dykeman Rd (612 1 2)
- 612 Dykeman Rd