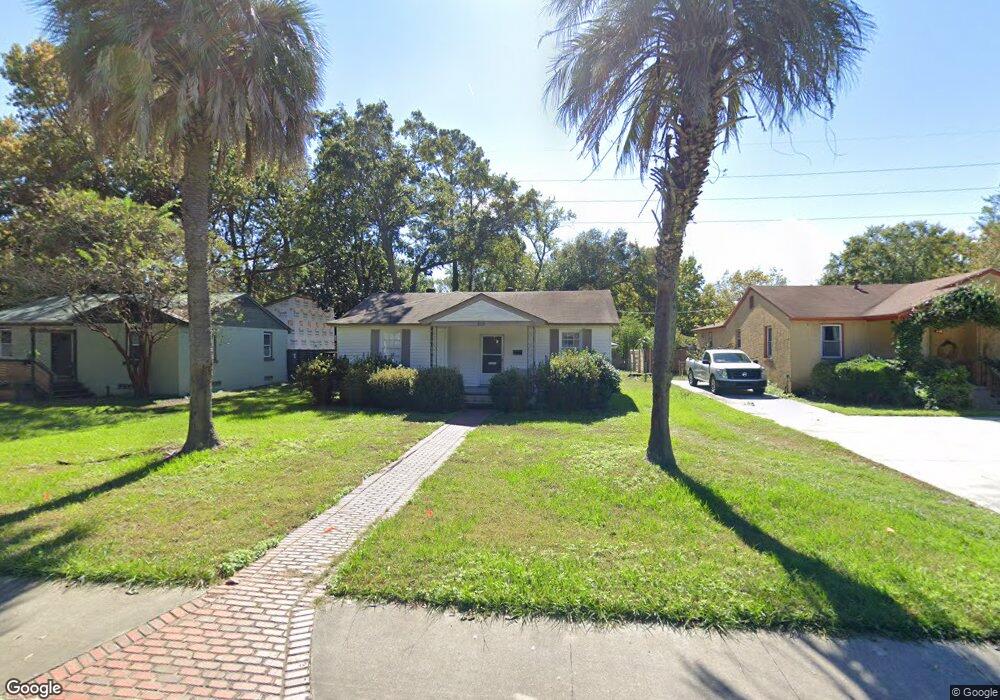
503 E 65th St Savannah, GA 31405
Abercorn Heights-Lamara Heights NeighborhoodEstimated Value: $316,000 - $368,000
2
Beds
2
Baths
1,268
Sq Ft
$272/Sq Ft
Est. Value
About This Home
This home is located at 503 E 65th St, Savannah, GA 31405 and is currently estimated at $344,855, approximately $271 per square foot. 503 E 65th St is a home located in Chatham County with nearby schools including Jacob G. Smith Elementary School, Myers Middle School, and Jenkins High School.
Ownership History
Date
Name
Owned For
Owner Type
Purchase Details
Closed on
Mar 24, 2017
Sold by
Fiore Jordan T
Bought by
Olvey Joseph Norwood
Current Estimated Value
Home Financials for this Owner
Home Financials are based on the most recent Mortgage that was taken out on this home.
Original Mortgage
$132,554
Outstanding Balance
$110,914
Interest Rate
4.5%
Mortgage Type
FHA
Estimated Equity
$233,941
Purchase Details
Closed on
Nov 23, 2004
Sold by
Mcgrath Stephen A and Mcgrath Mary L
Bought by
Fiore Jordan T
Create a Home Valuation Report for This Property
The Home Valuation Report is an in-depth analysis detailing your home's value as well as a comparison with similar homes in the area
Home Values in the Area
Average Home Value in this Area
Purchase History
| Date | Buyer | Sale Price | Title Company |
|---|---|---|---|
| Olvey Joseph Norwood | $135,000 | -- | |
| Fiore Jordan T | $134,500 | -- |
Source: Public Records
Mortgage History
| Date | Status | Borrower | Loan Amount |
|---|---|---|---|
| Open | Olvey Joseph Norwood | $132,554 |
Source: Public Records
Tax History
| Year | Tax Paid | Tax Assessment Tax Assessment Total Assessment is a certain percentage of the fair market value that is determined by local assessors to be the total taxable value of land and additions on the property. | Land | Improvement |
|---|---|---|---|---|
| 2025 | $1,250 | $86,200 | $29,200 | $57,000 |
| 2024 | $7 | $71,880 | $29,200 | $42,680 |
| 2023 | $402 | $78,440 | $29,200 | $49,240 |
| 2022 | $1,149 | $59,280 | $12,800 | $46,480 |
| 2021 | $1,709 | $53,760 | $12,800 | $40,960 |
| 2020 | $1,087 | $48,160 | $12,800 | $35,360 |
| 2019 | $1,607 | $40,440 | $12,800 | $27,640 |
| 2018 | $1,084 | $40,360 | $12,800 | $27,560 |
| 2017 | $1,216 | $41,480 | $12,800 | $28,680 |
| 2016 | $1,151 | $39,440 | $12,800 | $26,640 |
| 2015 | $1,692 | $40,560 | $12,800 | $27,760 |
| 2014 | $2,231 | $40,160 | $0 | $0 |
Source: Public Records
Map
Nearby Homes
- 513 E 64th St
- 507 E 63rd St
- 315 E 65th St
- 406 E 63rd St
- 513 E 62nd St
- 244 E 64th St
- 223 E 64th St
- 301 Lafayette Cir
- 218 E 65th St
- 416 E 61st St
- 415 E 60th St
- 202 E 64th St
- 0 E 70th St Unit SA350287
- 116 E 66th St
- 425 Columbus Dr
- 622 E 60th St
- 5205 Habersham St
- 120 E 66th St
- 311A Columbus Dr
- 130 Brandywine Rd
Your Personal Tour Guide
Ask me questions while you tour the home.