Estimated Value: $177,000 - $215,000
3
Beds
2
Baths
1,872
Sq Ft
$101/Sq Ft
Est. Value
About This Home
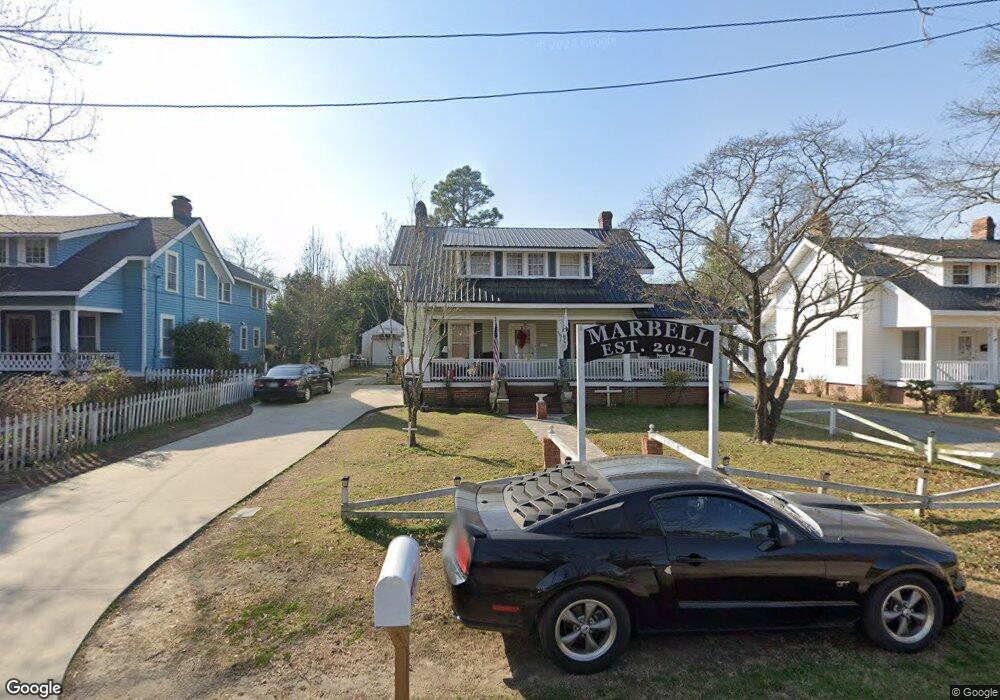
This home is located at 503 E H St, Erwin, NC 28339 and is currently estimated at $189,912, approximately $101 per square foot. 503 E H St is a home located in Harnett County with nearby schools including Erwin Elementary School, Coats-Erwin Middle School, and Triton High School.
Ownership History
Date
Name
Owned For
Owner Type
Purchase Details
Closed on
Jun 27, 2016
Sold by
Grady William O
Bought by
Marbell Timothy David and Marbell Brenda S
Current Estimated Value
Home Financials for this Owner
Home Financials are based on the most recent Mortgage that was taken out on this home.
Original Mortgage
$53,200
Outstanding Balance
$42,552
Interest Rate
3.64%
Mortgage Type
New Conventional
Estimated Equity
$147,360
Purchase Details
Closed on
Feb 29, 2016
Sold by
Tart Joseph L
Bought by
Brown Jordan Grady and Grady William O
Purchase Details
Closed on
Jun 7, 2015
Sold by
Tart Chris and Tart Kimberly
Bought by
Tart Joseph L
Purchase Details
Closed on
Jan 8, 2015
Sold by
Grady Sylvia Yvonne
Bought by
Tart Joseph L
Purchase Details
Closed on
Apr 1, 2011
Sold by
Grady Ronelle E
Bought by
Grady Daniel Monroe and Grady Ronelle E
Create a Home Valuation Report for This Property
The Home Valuation Report is an in-depth analysis detailing your home's value as well as a comparison with similar homes in the area
Home Values in the Area
Average Home Value in this Area
Purchase History
| Date | Buyer | Sale Price | Title Company |
|---|---|---|---|
| Marbell Timothy David | $66,500 | -- | |
| Brown Jordan Grady | -- | -- | |
| Tart Joseph L | -- | None Available | |
| Tart Joseph L | -- | None Available | |
| Grady Daniel Monroe | -- | -- |
Source: Public Records
Mortgage History
| Date | Status | Borrower | Loan Amount |
|---|---|---|---|
| Open | Marbell Timothy David | $53,200 |
Source: Public Records
Tax History
| Year | Tax Paid | Tax Assessment Tax Assessment Total Assessment is a certain percentage of the fair market value that is determined by local assessors to be the total taxable value of land and additions on the property. | Land | Improvement |
|---|---|---|---|---|
| 2025 | $1,635 | $129,627 | $0 | $0 |
| 2024 | $1,596 | $129,627 | $0 | $0 |
| 2023 | $1,596 | $129,627 | $0 | $0 |
| 2022 | $1,596 | $129,627 | $0 | $0 |
| 2021 | $1,349 | $93,320 | $0 | $0 |
| 2020 | $1,349 | $93,320 | $0 | $0 |
| 2019 | $1,334 | $93,320 | $0 | $0 |
| 2018 | $1,325 | $93,320 | $0 | $0 |
| 2017 | $1,325 | $93,320 | $0 | $0 |
| 2016 | $1,565 | $111,530 | $0 | $0 |
| 2015 | $952 | $111,530 | $0 | $0 |
| 2014 | $952 | $111,530 | $0 | $0 |
Source: Public Records
Map
Nearby Homes
- 301 S 7th St
- 303 Denim Dr
- 301 E H St
- 0 E I St Unit 10098436
- 305 N 10th St
- 107 N 12th St
- 202 N 6th St
- 105 E I St
- #1 US Highway 421
- 40 Birchstone Trail Unit 225p
- 100 E E St
- 0 Masonic Rd
- 49 Cypress Hollow Ln Unit 118p
- 500 S 13th St
- 100 E C St
- 0 E Jackson Blvd Unit 10140762
- 660 E Jackson Blvd
- 650 E Jackson Blvd
- 204 W E St
- 203 4th St
Your Personal Tour Guide
Ask me questions while you tour the home.