Estimated Value: $295,766 - $301,000
3
Beds
2
Baths
2,520
Sq Ft
$118/Sq Ft
Est. Value
About This Home
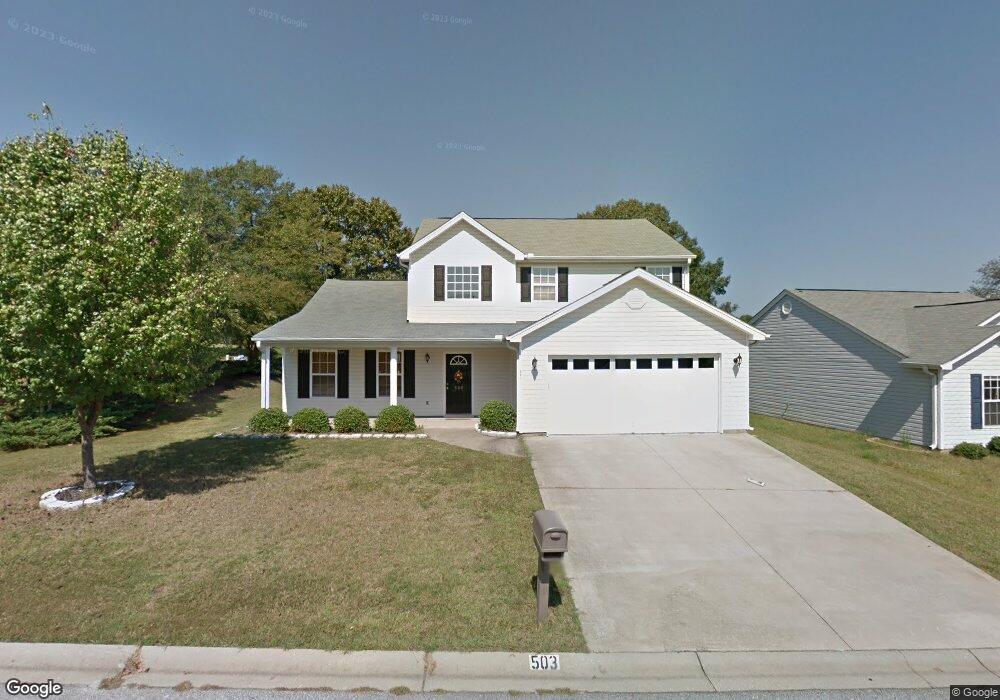
This home is located at 503 Hamilton Chase Dr, Moore, SC 29369 and is currently estimated at $298,442, approximately $118 per square foot. 503 Hamilton Chase Dr is a home located in Spartanburg County with nearby schools including Dorman High School Freshman Campus, Dorman High School, and GREEN Charter School Spartanburg.
Ownership History
Date
Name
Owned For
Owner Type
Purchase Details
Closed on
Dec 23, 2019
Sold by
Torres Marcelo and Torres Karen
Bought by
Torrez Marcelo and Torrez Karen E
Current Estimated Value
Purchase Details
Closed on
May 18, 2007
Sold by
Renewed Residences Llc
Bought by
Torres Marcelo and Torres Karen
Home Financials for this Owner
Home Financials are based on the most recent Mortgage that was taken out on this home.
Original Mortgage
$147,900
Interest Rate
6.12%
Mortgage Type
Purchase Money Mortgage
Purchase Details
Closed on
Feb 26, 2007
Sold by
Byrd Robert and Byrd Sheila
Bought by
Renewed Residences Llc
Home Financials for this Owner
Home Financials are based on the most recent Mortgage that was taken out on this home.
Original Mortgage
$127,500
Interest Rate
6.19%
Mortgage Type
Purchase Money Mortgage
Create a Home Valuation Report for This Property
The Home Valuation Report is an in-depth analysis detailing your home's value as well as a comparison with similar homes in the area
Home Values in the Area
Average Home Value in this Area
Purchase History
| Date | Buyer | Sale Price | Title Company |
|---|---|---|---|
| Torrez Marcelo | -- | None Available | |
| Torres Marcelo | $147,900 | None Available | |
| Renewed Residences Llc | $115,000 | None Available |
Source: Public Records
Mortgage History
| Date | Status | Borrower | Loan Amount |
|---|---|---|---|
| Previous Owner | Torres Marcelo | $147,900 | |
| Previous Owner | Renewed Residences Llc | $127,500 |
Source: Public Records
Tax History Compared to Growth
Tax History
| Year | Tax Paid | Tax Assessment Tax Assessment Total Assessment is a certain percentage of the fair market value that is determined by local assessors to be the total taxable value of land and additions on the property. | Land | Improvement |
|---|---|---|---|---|
| 2025 | $1,271 | $7,469 | $799 | $6,670 |
| 2024 | $1,271 | $7,469 | $799 | $6,670 |
| 2023 | $1,271 | $7,469 | $799 | $6,670 |
| 2022 | $1,177 | $6,495 | $766 | $5,729 |
| 2021 | $1,177 | $6,495 | $766 | $5,729 |
| 2020 | $1,147 | $6,495 | $766 | $5,729 |
| 2019 | $1,137 | $6,495 | $766 | $5,729 |
| 2018 | $1,128 | $6,495 | $766 | $5,729 |
| 2017 | $969 | $5,648 | $800 | $4,848 |
| 2016 | $949 | $5,648 | $800 | $4,848 |
| 2015 | $956 | $5,648 | $800 | $4,848 |
| 2014 | $925 | $5,648 | $800 | $4,848 |
Source: Public Records
Map
Nearby Homes
- 105 Pimmitt Run
- 486 Brighton Woods Dr
- 1732 Constitution Ln
- 1728 Constitution Ln
- 115 Stockton Ln
- 1724 Constitution Ln
- 1720 Constitution Ln
- 1716 Constitution Ln
- 1820 Betsy Ross Dr
- 1824 Betsy Ross Dr
- 1813 Betsy Ross Dr
- 1817 Betsy Ross Dr
- 1821 Betsy Ross Dr
- 1825 Betsy Ross Dr
- 111 Castleford Rd
- 230 Donegal Dr
- 206 W Killarney Lake
- 507 Hamilton Chase Dr
- 511 Hamilton Chase Dr
- 502 Hamilton Chase Dr
- 506 Hamilton Chase Dr
- 4645 Anderson Mill Rd
- 515 Hamilton Chase Dr
- 510 Hamilton Chase Dr
- 103 Anderson Mill Place
- 4700 Anderson Mill Rd
- 105 Anderson Mill Place
- 4706 Anderson Mill Rd
- 514 Hamilton Chase Dr
- 101 Anderson Mill Place
- 519 Hamilton Chase Dr
- 205 Weston Valley Dr
- 207 Weston Valley Dr
- 203 Weston Valley Dr
- 209 Weston Valley Dr
- 518 Hamilton Chase Dr
- 217 Weston Valley Dr