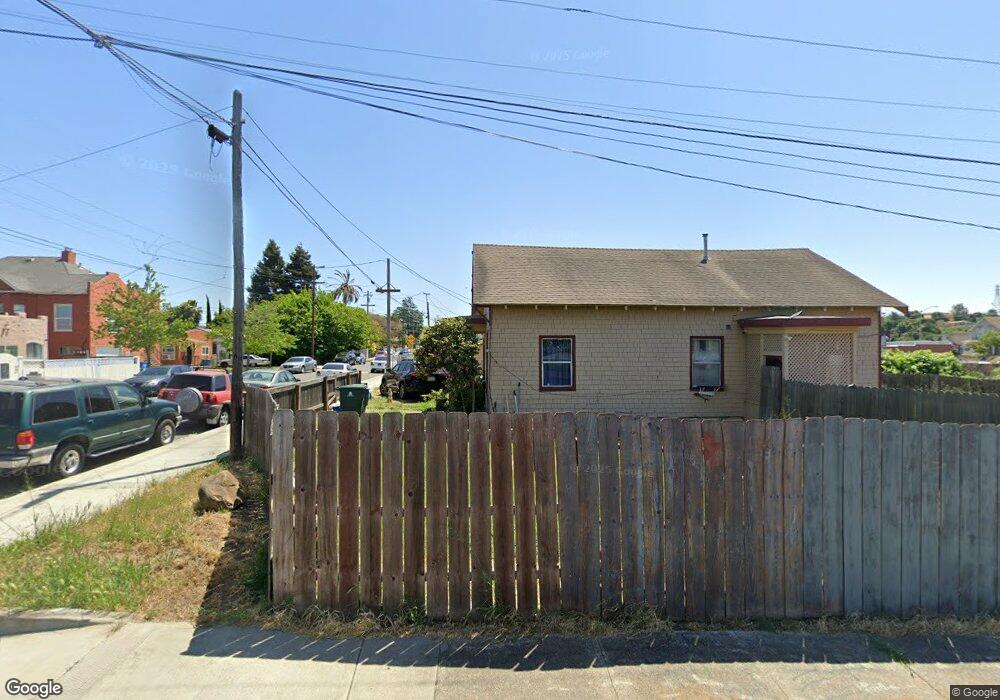
503 Mclane St Vallejo, CA 94590
South Vallejo NeighborhoodEstimated Value: $522,000 - $1,071,000
6
Beds
4
Baths
3,800
Sq Ft
$181/Sq Ft
Est. Value
About This Home
This home is located at 503 Mclane St, Vallejo, CA 94590 and is currently estimated at $686,440, approximately $180 per square foot. 503 Mclane St is a home located in Solano County with nearby schools including Grace Patterson Elementary School, Vallejo High School, and Mustard Seed Preschool and Kindergarten.
Ownership History
Date
Name
Owned For
Owner Type
Purchase Details
Closed on
Jul 8, 2010
Sold by
Kaeser Evelyn N
Bought by
Litton Loan Servicing Lp
Current Estimated Value
Home Financials for this Owner
Home Financials are based on the most recent Mortgage that was taken out on this home.
Original Mortgage
$260,000
Interest Rate
4.52%
Mortgage Type
New Conventional
Purchase Details
Closed on
May 27, 2010
Sold by
Kaeser Evelyn N
Bought by
Kuo Lawrence
Home Financials for this Owner
Home Financials are based on the most recent Mortgage that was taken out on this home.
Original Mortgage
$260,000
Interest Rate
4.52%
Mortgage Type
New Conventional
Purchase Details
Closed on
Apr 4, 2007
Sold by
Delancey Dennis M and The Dennis M Delancey Living T
Bought by
Kaeser Evelyn N
Home Financials for this Owner
Home Financials are based on the most recent Mortgage that was taken out on this home.
Original Mortgage
$800,000
Interest Rate
6.13%
Mortgage Type
New Conventional
Purchase Details
Closed on
Mar 11, 2005
Sold by
Scharsch Derek
Bought by
Delancey Dennis and Kaeser Evelyn
Home Financials for this Owner
Home Financials are based on the most recent Mortgage that was taken out on this home.
Original Mortgage
$143,000
Interest Rate
5.7%
Mortgage Type
Stand Alone Second
Purchase Details
Closed on
Dec 22, 2003
Sold by
Scharsch Laramie
Bought by
Scharsch Derek
Home Financials for this Owner
Home Financials are based on the most recent Mortgage that was taken out on this home.
Original Mortgage
$450,000
Interest Rate
8.99%
Mortgage Type
Purchase Money Mortgage
Purchase Details
Closed on
Dec 16, 2003
Sold by
Rothschild Helen Mae
Bought by
Scharsch Derek
Home Financials for this Owner
Home Financials are based on the most recent Mortgage that was taken out on this home.
Original Mortgage
$450,000
Interest Rate
8.99%
Mortgage Type
Purchase Money Mortgage
Create a Home Valuation Report for This Property
The Home Valuation Report is an in-depth analysis detailing your home's value as well as a comparison with similar homes in the area
Home Values in the Area
Average Home Value in this Area
Purchase History
| Date | Buyer | Sale Price | Title Company |
|---|---|---|---|
| Litton Loan Servicing Lp | $300,000 | Accommodation | |
| Kuo Lawrence | $325,000 | First American Title Co | |
| Kaeser Evelyn N | -- | Security Union Title Ins Co | |
| Delancey Dennis | $715,000 | North American Title Co | |
| Scharsch Derek | -- | North American Title Co | |
| Scharsch Derek | $450,000 | North American Title Co |
Source: Public Records
Mortgage History
| Date | Status | Borrower | Loan Amount |
|---|---|---|---|
| Previous Owner | Kuo Lawrence | $260,000 | |
| Previous Owner | Kaeser Evelyn N | $800,000 | |
| Previous Owner | Delancey Dennis | $143,000 | |
| Previous Owner | Delancey Dennis | $572,000 | |
| Previous Owner | Scharsch Derek | $450,000 | |
| Previous Owner | Scharsch Derek | $450,000 |
Source: Public Records
Tax History
| Year | Tax Paid | Tax Assessment Tax Assessment Total Assessment is a certain percentage of the fair market value that is determined by local assessors to be the total taxable value of land and additions on the property. | Land | Improvement |
|---|---|---|---|---|
| 2025 | $5,339 | $377,936 | $89,676 | $288,260 |
| 2024 | $5,339 | $370,526 | $87,918 | $282,608 |
| 2023 | $5,048 | $363,262 | $86,195 | $277,067 |
| 2022 | $4,961 | $356,140 | $84,505 | $271,635 |
| 2021 | $4,853 | $349,158 | $82,849 | $266,309 |
| 2020 | $4,883 | $345,579 | $82,000 | $263,579 |
| 2019 | $4,745 | $338,804 | $80,393 | $258,411 |
| 2018 | $4,448 | $332,162 | $78,817 | $253,345 |
| 2017 | $4,259 | $325,650 | $77,272 | $248,378 |
| 2016 | $3,679 | $319,265 | $75,757 | $243,508 |
| 2015 | $3,630 | $314,471 | $74,620 | $239,851 |
| 2014 | $3,580 | $308,312 | $73,159 | $235,153 |
Source: Public Records
Map
Nearby Homes
Your Personal Tour Guide
Ask me questions while you tour the home.