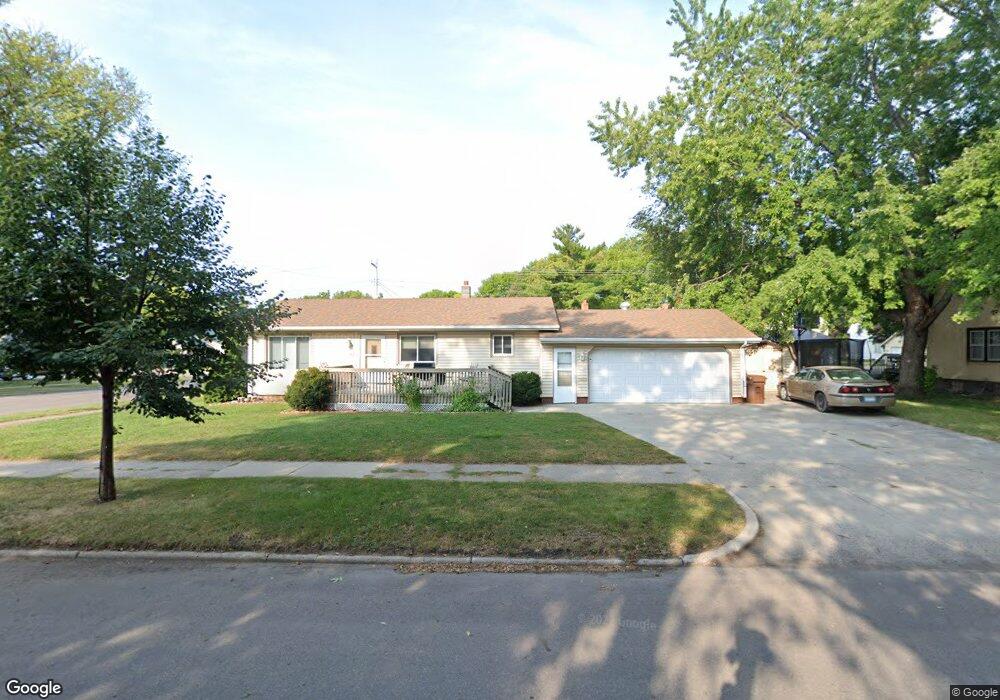
503 N 5th St Montevideo, MN 56265
Estimated Value: $141,000 - $182,382
2
Beds
2
Baths
962
Sq Ft
$169/Sq Ft
Est. Value
About This Home
This home is located at 503 N 5th St, Montevideo, MN 56265 and is currently estimated at $162,346, approximately $168 per square foot. 503 N 5th St is a home located in Chippewa County with nearby schools including Sanford Education Center, Ramsey Elementary School, and Montevideo Middle School.
Ownership History
Date
Name
Owned For
Owner Type
Purchase Details
Closed on
Dec 19, 2019
Sold by
Claude S Larson Ret
Bought by
Moe Brennan
Current Estimated Value
Home Financials for this Owner
Home Financials are based on the most recent Mortgage that was taken out on this home.
Original Mortgage
$84,390
Outstanding Balance
$74,402
Interest Rate
3.6%
Mortgage Type
New Conventional
Estimated Equity
$87,944
Purchase Details
Closed on
Sep 16, 2016
Sold by
Olson Ardis M
Bought by
Larson Claude S and Larson Ruth A
Purchase Details
Closed on
Aug 30, 2006
Sold by
Siverhus Betty L
Bought by
Olson Ervin J and Olson Ardis M
Create a Home Valuation Report for This Property
The Home Valuation Report is an in-depth analysis detailing your home's value as well as a comparison with similar homes in the area
Home Values in the Area
Average Home Value in this Area
Purchase History
| Date | Buyer | Sale Price | Title Company |
|---|---|---|---|
| Moe Brennan | $87,000 | None Available | |
| Larson Claude S | $70,000 | Attorney | |
| Olson Ervin J | $80,000 | None Available |
Source: Public Records
Mortgage History
| Date | Status | Borrower | Loan Amount |
|---|---|---|---|
| Open | Moe Brennan | $84,390 |
Source: Public Records
Tax History Compared to Growth
Tax History
| Year | Tax Paid | Tax Assessment Tax Assessment Total Assessment is a certain percentage of the fair market value that is determined by local assessors to be the total taxable value of land and additions on the property. | Land | Improvement |
|---|---|---|---|---|
| 2025 | $1,906 | $146,700 | $5,700 | $141,000 |
| 2024 | $1,890 | $144,700 | $5,700 | $139,000 |
| 2023 | $1,590 | $144,700 | $5,700 | $139,000 |
| 2022 | $1,448 | $116,600 | $5,700 | $110,900 |
| 2021 | $1,338 | $107,300 | $5,700 | $101,600 |
| 2020 | $1,552 | $92,200 | $5,000 | $87,200 |
| 2019 | $1,252 | $88,400 | $5,000 | $83,400 |
| 2018 | $1,216 | $68,951 | $0 | $0 |
| 2017 | $1,056 | $83,900 | $0 | $0 |
| 2016 | $576 | $58,100 | $0 | $0 |
| 2015 | -- | $58,100 | $0 | $0 |
| 2014 | -- | $48,300 | $0 | $0 |
| 2013 | -- | $48,300 | $0 | $0 |
Source: Public Records
Map
Nearby Homes