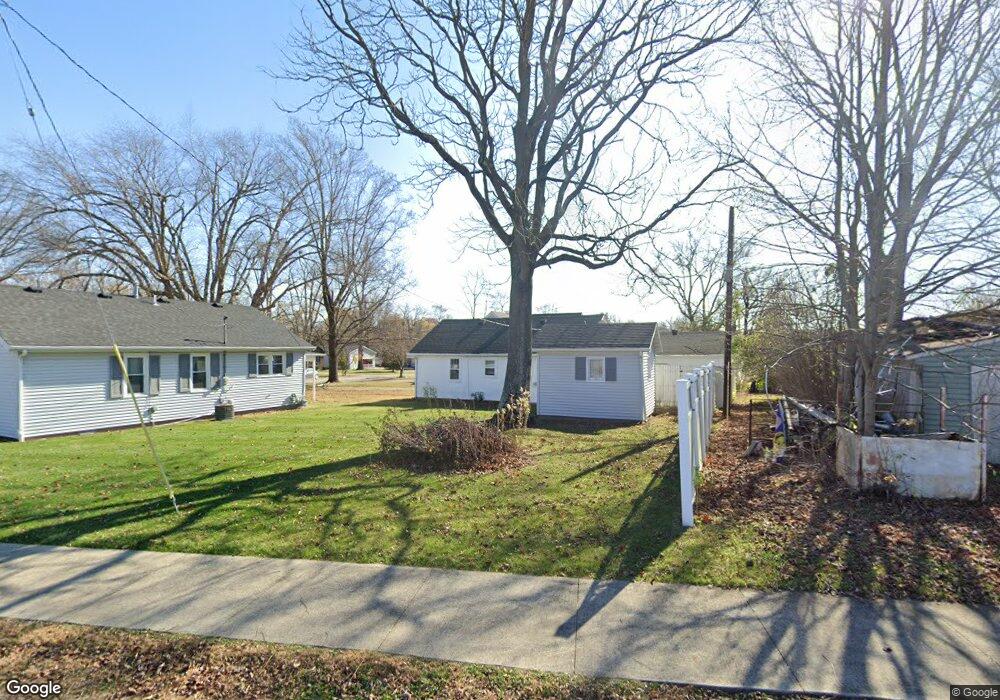
503 S 2nd St Effingham, IL 62401
Estimated Value: $62,000 - $205,000
2
Beds
1
Bath
600
Sq Ft
$195/Sq Ft
Est. Value
About This Home
This home is located at 503 S 2nd St, Effingham, IL 62401 and is currently estimated at $116,714, approximately $194 per square foot. 503 S 2nd St is a home located in Effingham County with nearby schools including South Side Grade School, Early Learning Center, and Central Grade School.
Ownership History
Date
Name
Owned For
Owner Type
Purchase Details
Closed on
Oct 25, 2023
Sold by
Reed Gary D and Reed Debra K
Bought by
Meyers Brian
Current Estimated Value
Home Financials for this Owner
Home Financials are based on the most recent Mortgage that was taken out on this home.
Original Mortgage
$47,025
Outstanding Balance
$46,244
Interest Rate
8%
Mortgage Type
New Conventional
Estimated Equity
$70,471
Purchase Details
Closed on
Jul 10, 2013
Sold by
Reed Tyson
Bought by
Reed Gary D and Reed Debra K
Purchase Details
Closed on
Jan 30, 2012
Sold by
Rueff James F
Bought by
Reed Tyson
Home Financials for this Owner
Home Financials are based on the most recent Mortgage that was taken out on this home.
Original Mortgage
$130,000
Interest Rate
3.95%
Mortgage Type
Unknown
Purchase Details
Closed on
Mar 25, 2005
Sold by
Mccarty Hubert and Mccarty Mary Ruth
Bought by
Rueff James F and Rueff Wilma K
Create a Home Valuation Report for This Property
The Home Valuation Report is an in-depth analysis detailing your home's value as well as a comparison with similar homes in the area
Home Values in the Area
Average Home Value in this Area
Purchase History
| Date | Buyer | Sale Price | Title Company |
|---|---|---|---|
| Meyers Brian | $189,000 | None Listed On Document | |
| Meyers Brian | -- | None Listed On Document | |
| Reed Gary D | $36,000 | None Available | |
| Reed Tyson | -- | None Available | |
| Rueff James F | -- | None Available |
Source: Public Records
Mortgage History
| Date | Status | Borrower | Loan Amount |
|---|---|---|---|
| Open | Meyers Brian | $47,025 | |
| Closed | Meyers Brian | $47,025 | |
| Previous Owner | Reed Tyson | $130,000 |
Source: Public Records
Tax History
| Year | Tax Paid | Tax Assessment Tax Assessment Total Assessment is a certain percentage of the fair market value that is determined by local assessors to be the total taxable value of land and additions on the property. | Land | Improvement |
|---|---|---|---|---|
| 2024 | $1,161 | $17,190 | $7,820 | $9,370 |
| 2023 | $1,064 | $15,630 | $7,110 | $8,520 |
| 2022 | $999 | $14,340 | $6,520 | $7,820 |
| 2021 | $1,030 | $14,200 | $6,460 | $7,740 |
| 2020 | $1,011 | $13,800 | $6,280 | $7,520 |
| 2019 | $993 | $13,670 | $6,220 | $7,450 |
| 2018 | $960 | $13,140 | $5,980 | $7,160 |
| 2017 | $944 | $12,880 | $5,860 | $7,020 |
| 2016 | $924 | $12,510 | $5,690 | $6,820 |
| 2015 | -- | $12,140 | $5,520 | $6,620 |
| 2014 | -- | $11,790 | $5,360 | $6,430 |
| 2013 | -- | $11,550 | $5,250 | $6,300 |
| 2012 | -- | $11,380 | $5,170 | $6,210 |
Source: Public Records
Map
Nearby Homes
- 405 S 4th St
- 806 S 4th St
- 906 S 3rd St
- 104 S Willow St
- 703 E Jefferson Ave
- 307 W Crawford Ave
- 210 W Wabash Ave
- 719 E Jefferson Ave
- 1110 S 2nd St
- 308 E Kreke Ave
- 508 E Saint Louis Ave
- 921 Lynn Dr
- 302 N Main St
- 602 S Linden St
- 108 W Virginia Ave
- 710 W Richland Ave
- 203 S Mulberry St
- 310 W Kagay Ave
- 105 W Kagay Ave
- 406 W Kentucky Ave
Your Personal Tour Guide
Ask me questions while you tour the home.