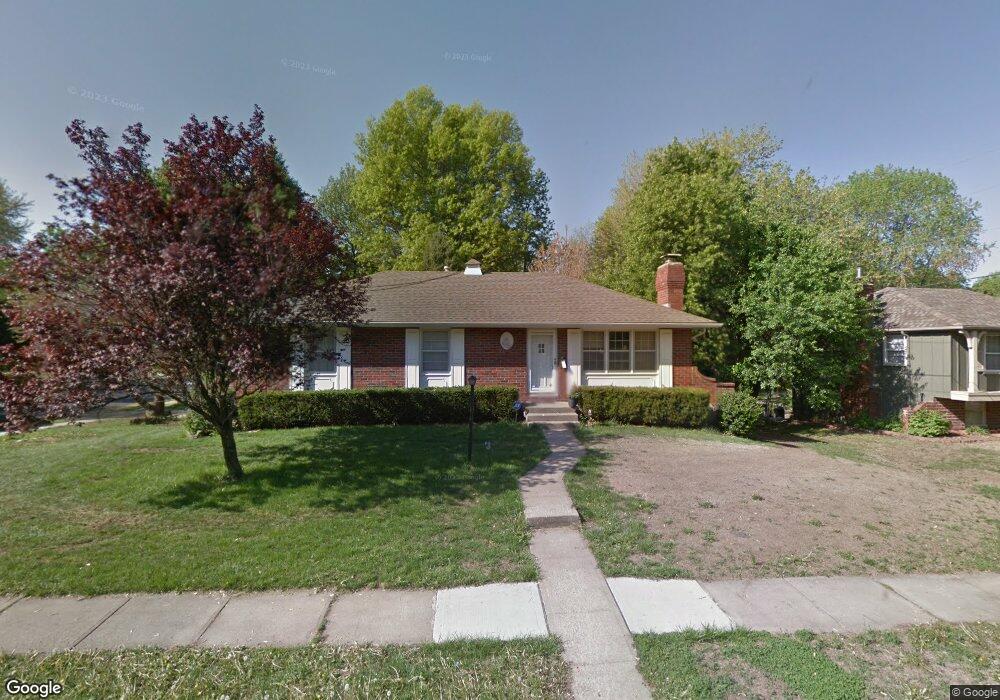
503 SW Stratford Rd Lees Summit, MO 64081
Estimated Value: $264,903 - $319,000
3
Beds
3
Baths
1,326
Sq Ft
$219/Sq Ft
Est. Value
About This Home
This home is located at 503 SW Stratford Rd, Lees Summit, MO 64081 and is currently estimated at $290,726, approximately $219 per square foot. 503 SW Stratford Rd is a home located in Jackson County with nearby schools including Pleasant Lea Middle School, Lee's Summit Senior High School, and Summit Christian Academy.
Ownership History
Date
Name
Owned For
Owner Type
Purchase Details
Closed on
Feb 26, 2016
Sold by
Coral Properties Llc
Bought by
Im Lawrence and Im Sandy Young Joo
Current Estimated Value
Home Financials for this Owner
Home Financials are based on the most recent Mortgage that was taken out on this home.
Original Mortgage
$108,000
Outstanding Balance
$85,646
Interest Rate
3.79%
Mortgage Type
New Conventional
Estimated Equity
$205,080
Purchase Details
Closed on
Oct 29, 2015
Sold by
Hayes Larry
Bought by
Coral Properties Llc
Purchase Details
Closed on
Oct 5, 2007
Sold by
Elliott Dora J
Bought by
Hayes Larry
Purchase Details
Closed on
Nov 10, 1999
Bought by
Elliott Dora J
Home Financials for this Owner
Home Financials are based on the most recent Mortgage that was taken out on this home.
Original Mortgage
$45,000
Interest Rate
7.73%
Mortgage Type
New Conventional
Create a Home Valuation Report for This Property
The Home Valuation Report is an in-depth analysis detailing your home's value as well as a comparison with similar homes in the area
Home Values in the Area
Average Home Value in this Area
Purchase History
| Date | Buyer | Sale Price | Title Company |
|---|---|---|---|
| Im Lawrence | $135,000 | Cosmopolitan Title Agency Ll | |
| Coral Properties Llc | $92,500 | None Available | |
| Hayes Larry | -- | Multiple | |
| Elliott Dora J | -- | -- |
Source: Public Records
Mortgage History
| Date | Status | Borrower | Loan Amount |
|---|---|---|---|
| Open | Im Lawrence | $108,000 | |
| Previous Owner | Elliott Dora J | $45,000 |
Source: Public Records
Tax History Compared to Growth
Tax History
| Year | Tax Paid | Tax Assessment Tax Assessment Total Assessment is a certain percentage of the fair market value that is determined by local assessors to be the total taxable value of land and additions on the property. | Land | Improvement |
|---|---|---|---|---|
| 2025 | $2,944 | $38,194 | $8,489 | $29,705 |
| 2024 | $2,923 | $40,778 | $8,463 | $32,315 |
| 2023 | $2,923 | $40,778 | $5,238 | $35,540 |
| 2022 | $2,331 | $28,880 | $5,344 | $23,536 |
| 2021 | $2,380 | $28,880 | $5,344 | $23,536 |
| 2020 | $2,281 | $27,408 | $5,344 | $22,064 |
| 2019 | $2,218 | $27,408 | $5,344 | $22,064 |
| 2018 | $2,080 | $23,854 | $4,651 | $19,203 |
| 2017 | $2,049 | $23,854 | $4,651 | $19,203 |
| 2016 | $2,049 | $23,256 | $5,168 | $18,088 |
| 2014 | $1,996 | $22,211 | $4,837 | $17,374 |
Source: Public Records
Map
Nearby Homes
- 1000 SW Lakeview Blvd
- 1019 SW Ingleside Place
- 907 SW Lea Dr
- 226 SW Pinetree Ln
- 949 SW Daney Dr
- 403 SW Mission Rd
- 701 SW Ward Rd
- 1052 SW Twin Creek Dr
- 1412 SW Madison St
- 3053 NW Thoreau Ln
- 411 SW Glendana St
- 1123 SW Hoke Dr
- 601 SE Miller St
- 134 SW Robin Rd
- 1406 SW Jefferson St
- 128 SW Hillcrest Ln
- 1501 SW Shelby Dr
- 1521 SW Hedgewood Ln
- 1402 SW Charleston Ave
- 420 NW Kaylea Ct
- 505 SW Stratford Rd
- 1016 SW Lakeview Blvd
- 507 SW Stratford Rd
- 1010 SW Lakeview Blvd
- 421 SW Stratford Rd
- 504 SW Stratford Rd
- 506 SW Stratford Rd
- 508 SW Stratford Rd
- 1018 SW Lakeview Blvd
- 1008 SW Lakeview Blvd
- 420 SW Stratford Rd
- 510 SW Stratford Rd
- 419 SW Stratford Rd
- 1009 SW Lakeview Blvd
- 1017 SW Noel Ct
- 1015 SW Noel Ct
- 1006 SW Lakeview Blvd
- 1020 SW Lakeview Blvd
- 512 SW Stratford Rd
- 1007 SW Lakeview Blvd