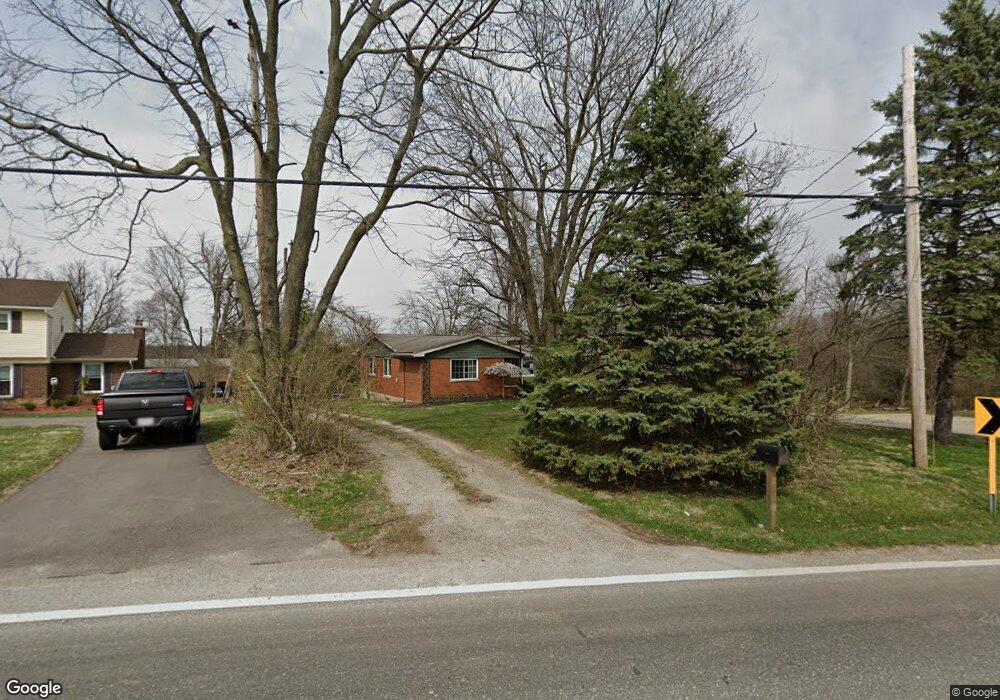
5030 W Fork Rd Cincinnati, OH 45247
West Monfort Heights NeighborhoodEstimated Value: $254,000 - $259,000
3
Beds
2
Baths
1,295
Sq Ft
$198/Sq Ft
Est. Value
About This Home
This home is located at 5030 W Fork Rd, Cincinnati, OH 45247 and is currently estimated at $256,465, approximately $198 per square foot. 5030 W Fork Rd is a home located in Hamilton County with nearby schools including Monfort Heights Elementary School, White Oak Middle School, and Colerain High School.
Ownership History
Date
Name
Owned For
Owner Type
Purchase Details
Closed on
Sep 10, 2009
Sold by
Fannie Mae
Bought by
Schaller Daniel J
Current Estimated Value
Home Financials for this Owner
Home Financials are based on the most recent Mortgage that was taken out on this home.
Original Mortgage
$135,411
Interest Rate
5.05%
Mortgage Type
FHA
Purchase Details
Closed on
Jun 26, 2009
Sold by
Messer Jason A and Messer Tavia L
Bought by
Fannie Mae and Federal National Mortgage Association
Purchase Details
Closed on
Jun 15, 1998
Sold by
Armutat Andrew K
Bought by
Messer Jason A and Messer Tavia L
Home Financials for this Owner
Home Financials are based on the most recent Mortgage that was taken out on this home.
Original Mortgage
$96,030
Interest Rate
7.27%
Create a Home Valuation Report for This Property
The Home Valuation Report is an in-depth analysis detailing your home's value as well as a comparison with similar homes in the area
Home Values in the Area
Average Home Value in this Area
Purchase History
| Date | Buyer | Sale Price | Title Company |
|---|---|---|---|
| Schaller Daniel J | $106,900 | None Available | |
| Fannie Mae | $131,320 | None Available | |
| Messer Jason A | $99,000 | -- |
Source: Public Records
Mortgage History
| Date | Status | Borrower | Loan Amount |
|---|---|---|---|
| Previous Owner | Schaller Daniel J | $135,411 | |
| Previous Owner | Messer Jason A | $96,030 |
Source: Public Records
Tax History Compared to Growth
Tax History
| Year | Tax Paid | Tax Assessment Tax Assessment Total Assessment is a certain percentage of the fair market value that is determined by local assessors to be the total taxable value of land and additions on the property. | Land | Improvement |
|---|---|---|---|---|
| 2024 | $3,620 | $68,177 | $16,720 | $51,457 |
| 2023 | $3,637 | $68,177 | $16,720 | $51,457 |
| 2022 | $3,133 | $47,950 | $16,282 | $31,668 |
| 2021 | $2,873 | $47,950 | $16,282 | $31,668 |
| 2020 | $2,901 | $47,950 | $16,282 | $31,668 |
| 2019 | $2,860 | $42,816 | $14,539 | $28,277 |
| 2018 | $2,779 | $42,816 | $14,539 | $28,277 |
| 2017 | $2,408 | $42,816 | $14,539 | $28,277 |
| 2016 | $2,117 | $37,041 | $14,501 | $22,540 |
| 2015 | $2,136 | $37,041 | $14,501 | $22,540 |
| 2014 | $2,140 | $37,041 | $14,501 | $22,540 |
| 2013 | $2,022 | $37,416 | $14,648 | $22,768 |
Source: Public Records
Map
Nearby Homes
- 4491 W Fork Rd
- 4593 Farview Ln
- 4600 Farcrest Ct
- 5563 Haft Rd
- 4252 Runningfawn Dr
- 4044 W Fork Rd
- 5380 Haft Rd
- 5340 Meadow Walk Ln
- 5320 Meadow Walk Ln
- 5160 Jessup Rd
- 5804 Cedaridge Dr
- 4628 Boomer Rd
- 5801 W Fork Rd
- 5171 N Bend Crossing
- 5165 N Bend Crossing
- Magnolia Plan at Ivy Rose - Designer Collection
- Blair Plan at Ivy Rose - Designer Collection
- Avery Plan at Ivy Rose - Designer Collection
- Winston Plan at Ivy Rose - Designer Collection
- Carrington Plan at Ivy Rose - Designer Collection