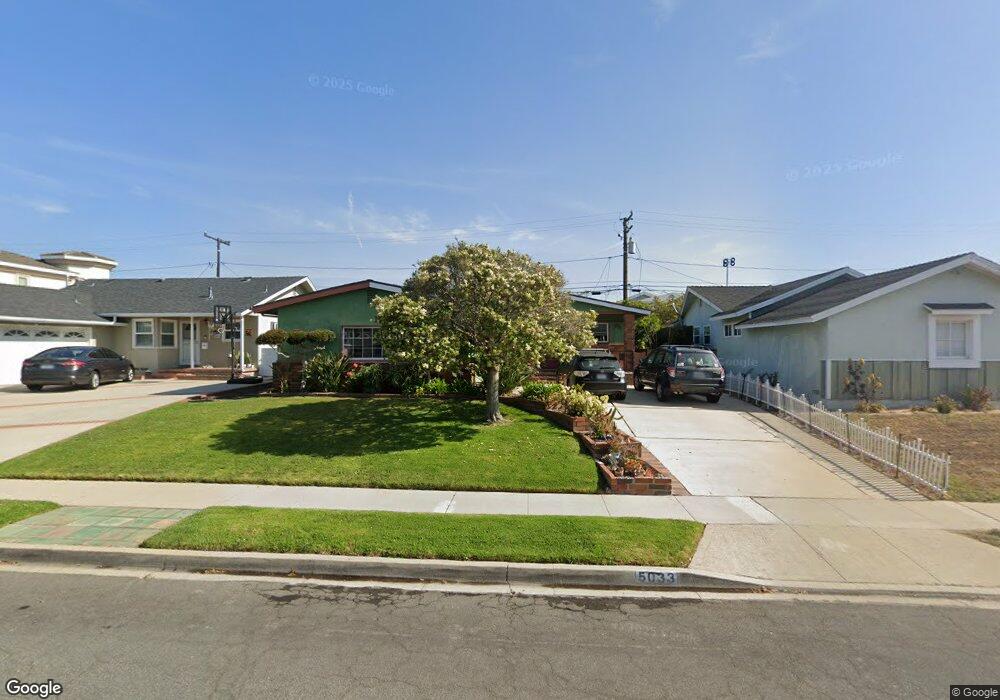
5033 Ruby St Torrance, CA 90503
Southwood NeighborhoodEstimated Value: $1,347,000 - $1,564,000
3
Beds
2
Baths
1,492
Sq Ft
$969/Sq Ft
Est. Value
About This Home
This home is located at 5033 Ruby St, Torrance, CA 90503 and is currently estimated at $1,445,526, approximately $968 per square foot. 5033 Ruby St is a home located in Los Angeles County with nearby schools including Anza Elementary School, Jefferson Middle School, and West High School.
Ownership History
Date
Name
Owned For
Owner Type
Purchase Details
Closed on
Apr 12, 2010
Sold by
Peterson Gary J and Bolton Jill D
Bought by
Mcclal Shannon P
Current Estimated Value
Home Financials for this Owner
Home Financials are based on the most recent Mortgage that was taken out on this home.
Original Mortgage
$520,000
Outstanding Balance
$344,962
Interest Rate
4.92%
Mortgage Type
New Conventional
Estimated Equity
$1,100,564
Purchase Details
Closed on
Jan 24, 1994
Sold by
Peterson Jack W and Peterson Ruth C
Bought by
Peterson Jack W
Home Financials for this Owner
Home Financials are based on the most recent Mortgage that was taken out on this home.
Original Mortgage
$105,000
Interest Rate
7.19%
Create a Home Valuation Report for This Property
The Home Valuation Report is an in-depth analysis detailing your home's value as well as a comparison with similar homes in the area
Home Values in the Area
Average Home Value in this Area
Purchase History
| Date | Buyer | Sale Price | Title Company |
|---|---|---|---|
| Mcclal Shannon P | $650,000 | Fidelity National Title Co | |
| Peterson Jack W | -- | Southland Title | |
| Peterson Jack W | -- | Southland Title Company |
Source: Public Records
Mortgage History
| Date | Status | Borrower | Loan Amount |
|---|---|---|---|
| Open | Mcclal Shannon P | $520,000 | |
| Previous Owner | Peterson Jack W | $105,000 |
Source: Public Records
Tax History
| Year | Tax Paid | Tax Assessment Tax Assessment Total Assessment is a certain percentage of the fair market value that is determined by local assessors to be the total taxable value of land and additions on the property. | Land | Improvement |
|---|---|---|---|---|
| 2025 | $9,497 | $839,021 | $671,224 | $167,797 |
| 2024 | $9,497 | $822,570 | $658,063 | $164,507 |
| 2023 | $9,321 | $806,442 | $645,160 | $161,282 |
| 2022 | $9,196 | $790,630 | $632,510 | $158,120 |
| 2021 | $9,030 | $775,128 | $620,108 | $155,020 |
| 2019 | $8,768 | $752,139 | $601,716 | $150,423 |
| 2018 | $8,469 | $737,392 | $589,918 | $147,474 |
| 2016 | $8,094 | $708,760 | $567,011 | $141,749 |
| 2015 | $7,917 | $698,114 | $558,494 | $139,620 |
| 2014 | $7,707 | $684,440 | $547,554 | $136,886 |
Source: Public Records
Map
Nearby Homes
- 21625 Bernice Ave
- 5102 Lee St
- 21913 Palos Verdes Blvd
- 21110 Wood Ave
- 21405 Mildred Ave
- 1200 Opal St Unit 7
- 5500 Torrance Blvd Unit B213
- 5500 Torrance Blvd Unit A211
- 1108 Camino Real Unit 407
- 1108 Camino Real Unit 409
- 1100 Barbara St
- 1110 Barbara St
- 603 S Prospect Ave Unit 205
- 5538 Lorna St
- 649 S Prospect Ave Unit 103
- 902 Camino Real Unit 208
- 802 Camino Real Unit 206
- 904 Knob Hill Ave
- 22421 Redbeam Ave
- 120 S Prospect Ave Unit A
Your Personal Tour Guide
Ask me questions while you tour the home.