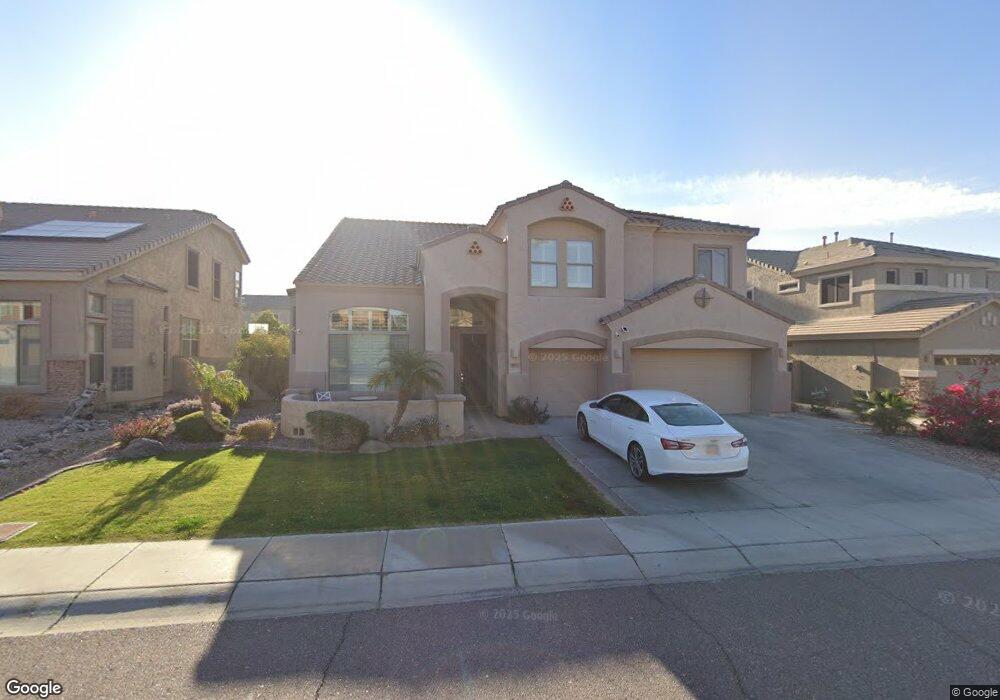
5033 W Yearling Rd Phoenix, AZ 85083
Stetson Valley NeighborhoodEstimated Value: $734,787 - $861,000
4
Beds
3
Baths
3,813
Sq Ft
$212/Sq Ft
Est. Value
About This Home
This home is located at 5033 W Yearling Rd, Phoenix, AZ 85083 and is currently estimated at $809,697, approximately $212 per square foot. 5033 W Yearling Rd is a home located in Maricopa County with nearby schools including Sandra Day O'connor High School, Hillcrest Middle School, and Bayer Private School.
Ownership History
Date
Name
Owned For
Owner Type
Purchase Details
Closed on
Mar 24, 2022
Sold by
Veronica Driggers
Bought by
Jonathan And Veronica Driggers Family Trust
Current Estimated Value
Purchase Details
Closed on
Sep 21, 2010
Sold by
Morris Ryan C and Morris Lisa M
Bought by
Driggers Jonathan E and Driggers Veronica
Home Financials for this Owner
Home Financials are based on the most recent Mortgage that was taken out on this home.
Original Mortgage
$286,100
Interest Rate
4.25%
Mortgage Type
FHA
Purchase Details
Closed on
Mar 12, 2007
Sold by
U S Home Corp
Bought by
Morris Ryan C and Morris Lisa M
Home Financials for this Owner
Home Financials are based on the most recent Mortgage that was taken out on this home.
Original Mortgage
$366,150
Interest Rate
6.29%
Mortgage Type
New Conventional
Purchase Details
Closed on
Oct 24, 2006
Sold by
Stetson Venture Ii Llc
Bought by
U S Home Corp
Create a Home Valuation Report for This Property
The Home Valuation Report is an in-depth analysis detailing your home's value as well as a comparison with similar homes in the area
Home Values in the Area
Average Home Value in this Area
Purchase History
| Date | Buyer | Sale Price | Title Company |
|---|---|---|---|
| Jonathan And Veronica Driggers Family Trust | -- | Reynoso Luke | |
| Jonathan And Veronica Driggers Family Trust | -- | Reynoso Luke | |
| Driggers Jonathan E | $290,000 | Old Republic Title Agency | |
| Morris Ryan C | $457,743 | North American Title Co | |
| U S Home Corp | $9,416,487 | Magnus Title Agency |
Source: Public Records
Mortgage History
| Date | Status | Borrower | Loan Amount |
|---|---|---|---|
| Previous Owner | Driggers Jonathan E | $286,100 | |
| Previous Owner | Morris Ryan C | $366,150 |
Source: Public Records
Tax History Compared to Growth
Tax History
| Year | Tax Paid | Tax Assessment Tax Assessment Total Assessment is a certain percentage of the fair market value that is determined by local assessors to be the total taxable value of land and additions on the property. | Land | Improvement |
|---|---|---|---|---|
| 2025 | $3,659 | $41,522 | -- | -- |
| 2024 | $3,537 | $39,545 | -- | -- |
| 2023 | $3,537 | $55,300 | $11,060 | $44,240 |
| 2022 | $3,398 | $39,910 | $7,980 | $31,930 |
| 2021 | $3,534 | $37,720 | $7,540 | $30,180 |
| 2020 | $3,469 | $36,080 | $7,210 | $28,870 |
| 2019 | $3,362 | $35,360 | $7,070 | $28,290 |
| 2018 | $3,245 | $34,480 | $6,890 | $27,590 |
| 2017 | $3,134 | $32,760 | $6,550 | $26,210 |
| 2016 | $2,957 | $37,180 | $7,430 | $29,750 |
| 2015 | $2,639 | $37,730 | $7,540 | $30,190 |
Source: Public Records
Map
Nearby Homes
- 5046 W Parsons Rd
- 5026 W Parsons Rd
- 25914 N 49th Ln
- 5131 W El Cortez Trail
- 5420 W El Cortez Trail
- 5123 W Saddlehorn Rd
- 5136 W Trotter Trail
- 25417 N 49th Dr
- 3310 W Jomax Rd
- 5121 W Andrea Ln
- 26704 N 55th Ave
- 26318 N 56th Dr
- 5606 W Cavedale Dr
- 5322 W Whispering Wind Dr
- 5452 W West Wind Dr
- 5343 W Whispering Wind Dr
- 5537 W Desperado Way
- 25417 N 45th Dr
- 2965 W Pinnacle Vista Dr
- 27321 N 51st Glen
- 5029 W Yearling Rd
- 5037 W Yearling Rd
- 5038 W Parsons Rd
- 5042 W Parsons Rd
- 5034 W Parsons Rd
- 5025 W Yearling Rd
- 5041 W Yearling Rd
- 5036 W Yearling Rd
- 5032 W Yearling Rd
- 5030 W Parsons Rd
- 5040 W Yearling Rd
- 5028 W Yearling Rd
- 5021 W Yearling Rd
- 5045 W Yearling Rd
- 5050 W Parsons Rd
- 5024 W Yearling Rd
- 5017 W Yearling Rd
- 25714 N 50th Glen
- 5039 W Parsons Rd
- 5035 W Lariat Ln