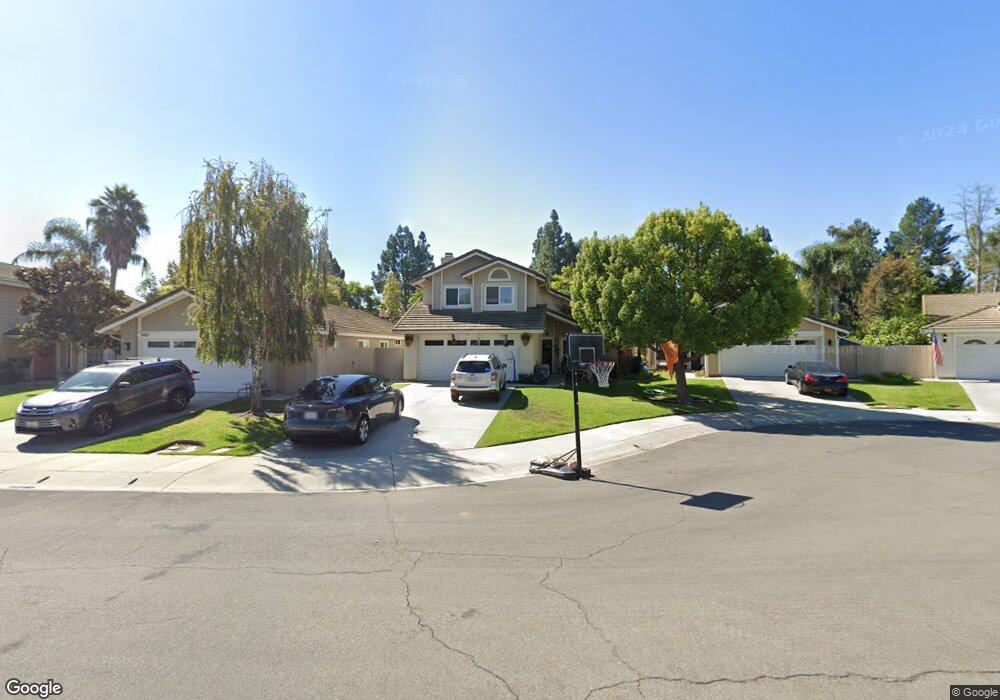
5036 Via Calderon Camarillo, CA 93012
Estimated Value: $823,430 - $1,013,000
3
Beds
3
Baths
1,493
Sq Ft
$607/Sq Ft
Est. Value
About This Home
This home is located at 5036 Via Calderon, Camarillo, CA 93012 and is currently estimated at $905,858, approximately $606 per square foot. 5036 Via Calderon is a home located in Ventura County with nearby schools including Tierra Linda Elementary School, Las Colinas Middle School, and Adolfo Camarillo High School.
Ownership History
Date
Name
Owned For
Owner Type
Purchase Details
Closed on
May 28, 2015
Sold by
Mueller Nancy N and Dufort Nancy
Bought by
Mueller Nancy N
Current Estimated Value
Purchase Details
Closed on
Jan 31, 2003
Sold by
Dufort Nancy
Bought by
Dufort Nancy
Purchase Details
Closed on
Sep 29, 1999
Sold by
Dufort Wayne A
Bought by
Dufort Nancy
Home Financials for this Owner
Home Financials are based on the most recent Mortgage that was taken out on this home.
Original Mortgage
$75,000
Outstanding Balance
$22,150
Interest Rate
7.77%
Estimated Equity
$883,708
Purchase Details
Closed on
Sep 10, 1999
Sold by
Moriarty Lloyd Sherrie A
Bought by
Dufort Nancy
Home Financials for this Owner
Home Financials are based on the most recent Mortgage that was taken out on this home.
Original Mortgage
$75,000
Outstanding Balance
$22,150
Interest Rate
7.77%
Estimated Equity
$883,708
Create a Home Valuation Report for This Property
The Home Valuation Report is an in-depth analysis detailing your home's value as well as a comparison with similar homes in the area
Home Values in the Area
Average Home Value in this Area
Purchase History
| Date | Buyer | Sale Price | Title Company |
|---|---|---|---|
| Mueller Nancy N | -- | None Available | |
| Dufort Nancy | -- | Chicago Title Co | |
| Dufort Nancy | -- | Fidelity National Title Co | |
| Dufort Nancy | $265,000 | Fidelity National Title Co |
Source: Public Records
Mortgage History
| Date | Status | Borrower | Loan Amount |
|---|---|---|---|
| Open | Dufort Nancy | $75,000 |
Source: Public Records
Tax History Compared to Growth
Tax History
| Year | Tax Paid | Tax Assessment Tax Assessment Total Assessment is a certain percentage of the fair market value that is determined by local assessors to be the total taxable value of land and additions on the property. | Land | Improvement |
|---|---|---|---|---|
| 2025 | $4,508 | $407,269 | $162,905 | $244,364 |
| 2024 | $4,508 | $399,284 | $159,711 | $239,573 |
| 2023 | $4,347 | $391,455 | $156,579 | $234,876 |
| 2022 | $4,334 | $383,780 | $153,509 | $230,271 |
| 2021 | $4,179 | $376,255 | $150,499 | $225,756 |
| 2020 | $4,164 | $372,398 | $148,956 | $223,442 |
| 2019 | $4,145 | $365,097 | $146,036 | $219,061 |
| 2018 | $4,069 | $357,939 | $143,173 | $214,766 |
| 2017 | $3,830 | $350,921 | $140,366 | $210,555 |
| 2016 | $3,739 | $344,041 | $137,614 | $206,427 |
| 2015 | $3,700 | $338,875 | $135,548 | $203,327 |
| 2014 | $3,615 | $332,239 | $132,894 | $199,345 |
Source: Public Records
Map
Nearby Homes
- 369 Estancia Place
- 5004 Ladera Vista Dr
- 196 Mariposa Dr
- 676 Buenos Tiempos Dr
- 860 Laurel Park Cir
- 16302 Village 16
- 4112 Village 4
- 5118 Village 5
- 353 Via Cantilena Unit 87
- 18 Tahquitz Ct Unit 217
- 7202 Village 7 Unit 7
- 18206 Village 18 Unit 18
- 113 Camino el Rincon
- 269 Via Cantilena
- 17101 Village 17
- 14 Tahquitz Ct Unit 213
- 790 Vista Palacio
- 210 Caleta Dr Unit 95
- 5302 Paseo Ricoso
- 6118 Village 6
- 5056 Via Calderon
- 5060 Via Calderon
- 5016 Via Calderon
- 5072 Via Calderon
- 5004 Via Calderon
- 5059 Via Calderon
- 5075 Via Calderon
- 5009 Via Calderon
- 5043 Via Calderon
- 5091 Via Calderon
- 5015 Via Calderon
- 5092 Via Calderon
- 5103 Via Calderon
- 5104 Via Calderon
- 5084 Mesquite St
- 5109 Via Calderon
- 5081 Mesquite St
- 5000 Santa Rosa Rd Unit B
- 5094 Mesquite St
- 5112 Via Calderon