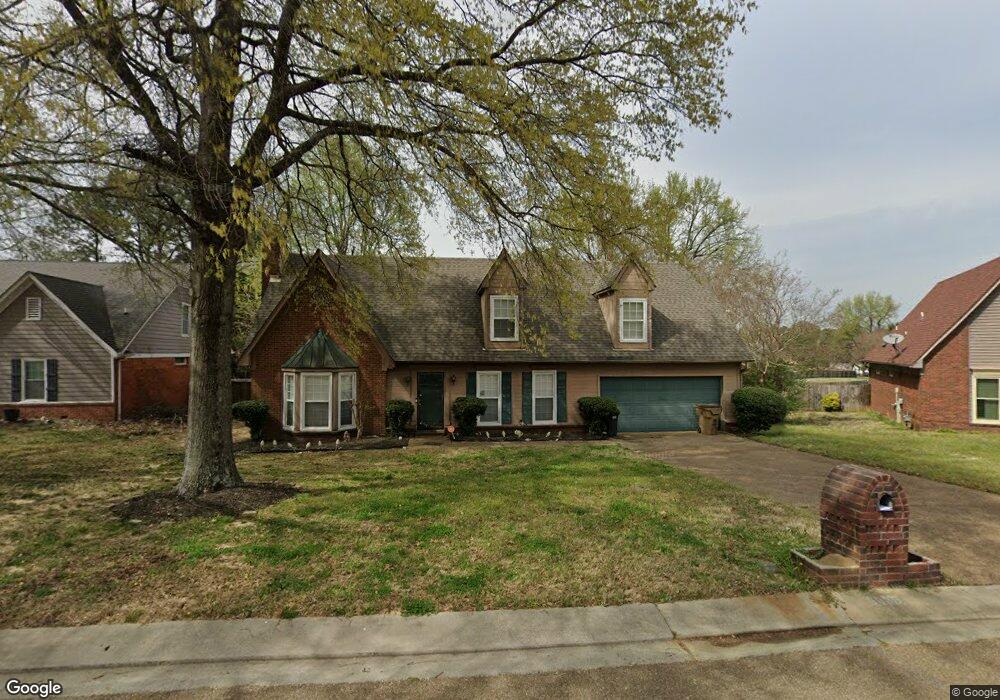
5039 Overview Ridge Cove Memphis, TN 38141
Hickory Hill NeighborhoodEstimated Value: $239,000 - $272,000
4
Beds
3
Baths
2,926
Sq Ft
$86/Sq Ft
Est. Value
About This Home
This home is located at 5039 Overview Ridge Cove, Memphis, TN 38141 and is currently estimated at $251,640, approximately $86 per square foot. 5039 Overview Ridge Cove is a home located in Shelby County with nearby schools including Highland Oaks Elementary School, Highland Oaks Middle School, and Southwind High School.
Ownership History
Date
Name
Owned For
Owner Type
Purchase Details
Closed on
Aug 17, 2023
Sold by
Pac Res Spe Iv Llc
Bought by
510 Sfr Tn Operations I Llc
Current Estimated Value
Purchase Details
Closed on
Feb 7, 2023
Sold by
Hrg Re Holdings Llc
Bought by
Pac Res Spe Iv Llc
Purchase Details
Closed on
Apr 16, 2018
Sold by
Mortgage Services Llc
Bought by
Hrg Re Holdings Llc
Purchase Details
Closed on
Nov 29, 2017
Sold by
Clear Rocon Llc
Bought by
Carrington Mortgage Services Llc
Purchase Details
Closed on
Jun 26, 2008
Sold by
Jackson Charles Steven
Bought by
Jackson Charles S and Jackson Retha A
Home Financials for this Owner
Home Financials are based on the most recent Mortgage that was taken out on this home.
Original Mortgage
$156,208
Interest Rate
6.37%
Mortgage Type
New Conventional
Purchase Details
Closed on
May 14, 1999
Sold by
Robinson Alfred B and Robinson Sherida O
Bought by
Hud
Purchase Details
Closed on
Feb 23, 1995
Bought by
Alfred and Robinson Sherida Robinson
Create a Home Valuation Report for This Property
The Home Valuation Report is an in-depth analysis detailing your home's value as well as a comparison with similar homes in the area
Home Values in the Area
Average Home Value in this Area
Purchase History
| Date | Buyer | Sale Price | Title Company |
|---|---|---|---|
| 510 Sfr Tn Operations I Llc | $243,000 | Total Title Services | |
| 510 Sfr Tn Operations I Llc | $235,000 | Total Title Services | |
| Pac Res Spe Iv Llc | $193,800 | Total Title Services | |
| Hrg Re Holdings Llc | $123,240 | None Available | |
| Carrington Mortgage Services Llc | $123,240 | None Available | |
| Jackson Charles S | -- | None Available | |
| Hud | $138,194 | -- | |
| Alfred | $109,000 | -- |
Source: Public Records
Mortgage History
| Date | Status | Borrower | Loan Amount |
|---|---|---|---|
| Previous Owner | Jackson Charles S | $156,208 |
Source: Public Records
Tax History Compared to Growth
Tax History
| Year | Tax Paid | Tax Assessment Tax Assessment Total Assessment is a certain percentage of the fair market value that is determined by local assessors to be the total taxable value of land and additions on the property. | Land | Improvement |
|---|---|---|---|---|
| 2025 | $1,571 | $63,425 | $12,475 | $50,950 |
| 2024 | -- | $46,350 | $6,775 | $39,575 |
| 2023 | $1,571 | $46,350 | $6,775 | $39,575 |
| 2022 | $1,571 | $46,350 | $6,775 | $39,575 |
| 2021 | $1,599 | $46,350 | $6,775 | $39,575 |
| 2020 | $1,273 | $31,425 | $6,775 | $24,650 |
| 2019 | $1,273 | $31,425 | $6,775 | $24,650 |
| 2018 | $1,273 | $31,425 | $6,775 | $24,650 |
| 2017 | $1,292 | $31,425 | $6,775 | $24,650 |
| 2016 | $1,391 | $31,825 | $0 | $0 |
| 2014 | $1,391 | $31,825 | $0 | $0 |
Source: Public Records
Map
Nearby Homes
- 6941 Bennington Cir
- 4935 Woodberry Cove
- 5084 Autumn Morning Ln
- 7125 Farmhouse Dr
- 6770 Shoreline Cir
- 5178 Autumn Morning Cove
- 6744 Shoreline Cir
- 6716 Shoreline Cir
- 5100 Sunny Autumn Ln
- 4927 Bradfield Run
- 6788 Burlingame Dr
- 6732 Henredon Dr
- 4868 Water Fowl Ln
- 7352 Red River Cove
- 4768 Bradfield Run
- 5265 Crystal Oak Dr
- 6696 Autumn Wood Cove
- 4821 Blue Wing St
- 7420 Iris Cove
- 5340 Shady Ridge Cove
- 5041 Overview Ridge Cove
- 5035 Overview Ridge Cove
- 5010 Woodberry Cove S
- 5043 Overview Ridge Cove
- 5032 Overview Ridge Cove
- 5042 Overview Ridge Cove
- 5040 Overview Ridge Cove
- 5008 Woodberry Cove S
- 5014 Woodberry Cove S
- 5004 Woodberry Cove S
- 5036 Overview Ridge Cove
- 5050 Overview Ridge Cove
- 5045 Overview Ridge Cove
- 5015 Woodberry Cove S
- 4996 Woodberry Cove S
- 5065 Clearpool Point N
- 6939 Bennington Cir
- 5011 Woodberry Cove S
- 5056 Overview Ridge Cove
- 5067 Clearpool Point N