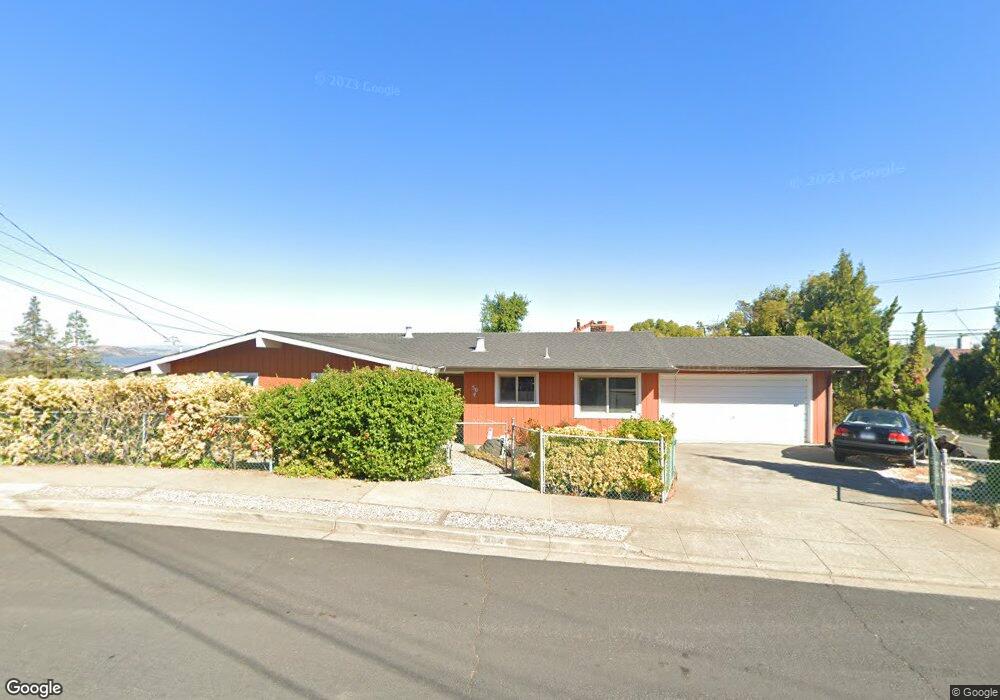
504 Bartolini St Martinez, CA 94553
Estimated Value: $677,000 - $797,000
3
Beds
2
Baths
1,481
Sq Ft
$488/Sq Ft
Est. Value
About This Home
This home is located at 504 Bartolini St, Martinez, CA 94553 and is currently estimated at $722,432, approximately $487 per square foot. 504 Bartolini St is a home located in Contra Costa County with nearby schools including John Muir Elementary School, Martinez Junior High School, and Alhambra Senior High School.
Ownership History
Date
Name
Owned For
Owner Type
Purchase Details
Closed on
Jun 14, 1999
Sold by
Lucas Robert H & Dolly J Tre
Bought by
Hall John Bert and Hall Adela E
Current Estimated Value
Home Financials for this Owner
Home Financials are based on the most recent Mortgage that was taken out on this home.
Original Mortgage
$199,200
Outstanding Balance
$52,536
Interest Rate
7.05%
Mortgage Type
Purchase Money Mortgage
Estimated Equity
$669,896
Purchase Details
Closed on
Feb 5, 1997
Sold by
Rowe Dolly J Tre
Bought by
Lucas Robert H and Lucas Dolly J
Purchase Details
Closed on
Mar 30, 1994
Sold by
Rowe Dolly J
Bought by
Rowe Dolly J
Create a Home Valuation Report for This Property
The Home Valuation Report is an in-depth analysis detailing your home's value as well as a comparison with similar homes in the area
Home Values in the Area
Average Home Value in this Area
Purchase History
| Date | Buyer | Sale Price | Title Company |
|---|---|---|---|
| Hall John Bert | $249,000 | Old Republic Title Company | |
| Lucas Robert H | -- | -- | |
| Rowe Dolly J | -- | -- |
Source: Public Records
Mortgage History
| Date | Status | Borrower | Loan Amount |
|---|---|---|---|
| Open | Hall John Bert | $199,200 |
Source: Public Records
Tax History
| Year | Tax Paid | Tax Assessment Tax Assessment Total Assessment is a certain percentage of the fair market value that is determined by local assessors to be the total taxable value of land and additions on the property. | Land | Improvement |
|---|---|---|---|---|
| 2025 | $5,467 | $390,334 | $148,918 | $241,416 |
| 2024 | $5,133 | $382,682 | $145,999 | $236,683 |
| 2023 | $5,133 | $375,180 | $143,137 | $232,043 |
| 2022 | $5,051 | $367,825 | $140,331 | $227,494 |
| 2021 | $4,892 | $360,614 | $137,580 | $223,034 |
| 2019 | $4,734 | $349,920 | $133,500 | $216,420 |
| 2018 | $4,581 | $343,060 | $130,883 | $212,177 |
| 2017 | $4,499 | $336,334 | $128,317 | $208,017 |
| 2016 | $4,191 | $329,740 | $125,801 | $203,939 |
| 2015 | $4,154 | $324,788 | $123,912 | $200,876 |
| 2014 | $4,142 | $318,427 | $121,485 | $196,942 |
Source: Public Records
Map
Nearby Homes
- 847 Shell Ave
- 2350 W Shell Ave
- 2115 Valente Cir
- 1050 Sierra Ave
- 513 Arch St
- 1021 Ulfinian Way
- 2220 S Crest Ave
- 720 Shell Ave
- 2437 Alhambra Ave
- 2280 N Crest Ave
- 2472 Monterey Ave
- 500 Wano St
- 1002 Warren St
- 2291 Yale St
- 871 Merle Ave
- 2547 Bella Vista Ave
- 2205 Scenic Ave
- 1333 Warren St
- 0 Palm Ave
- 1121 Haven St
Your Personal Tour Guide
Ask me questions while you tour the home.