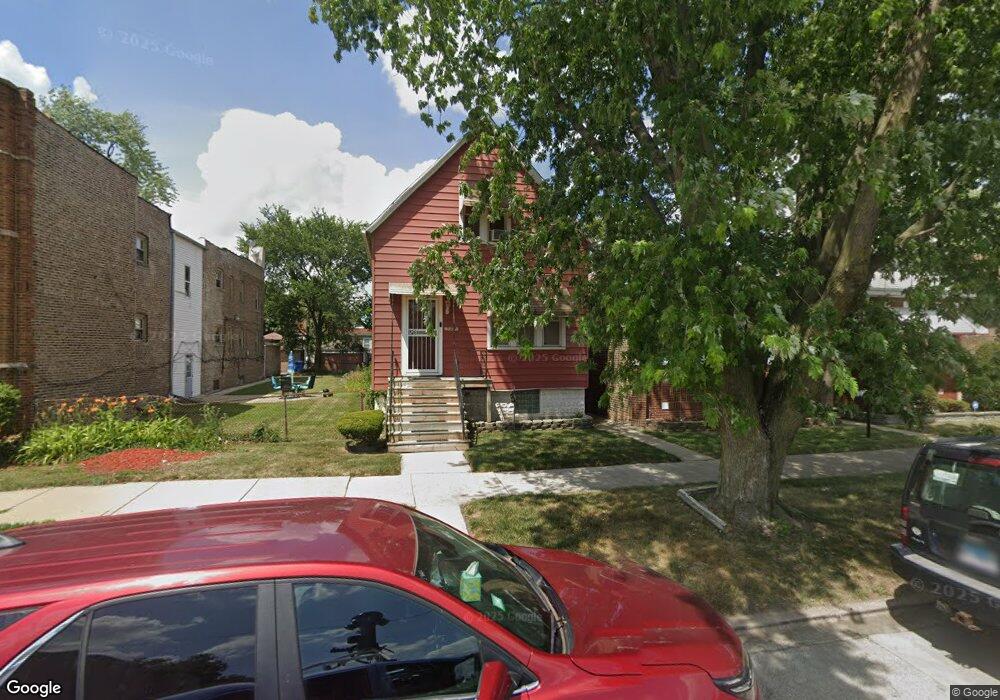
504 E 88th St Chicago, IL 60619
Chatham NeighborhoodEstimated Value: $167,418 - $217,000
3
Beds
1
Bath
1,382
Sq Ft
$141/Sq Ft
Est. Value
About This Home
This home is located at 504 E 88th St, Chicago, IL 60619 and is currently estimated at $194,855, approximately $140 per square foot. 504 E 88th St is a home located in Cook County with nearby schools including John T. Pirie Fine Arts and Academic Center, Dixon Elementary School, and Harlan Community Academy High School.
Ownership History
Date
Name
Owned For
Owner Type
Purchase Details
Closed on
May 16, 2006
Sold by
Jackson Pamela F
Bought by
Lattimore Frances J
Current Estimated Value
Home Financials for this Owner
Home Financials are based on the most recent Mortgage that was taken out on this home.
Original Mortgage
$163,000
Outstanding Balance
$94,244
Interest Rate
6.66%
Mortgage Type
Fannie Mae Freddie Mac
Estimated Equity
$100,611
Purchase Details
Closed on
Jul 11, 2005
Sold by
Great Lakes Trust Co Na
Bought by
Jackson Pamela F
Home Financials for this Owner
Home Financials are based on the most recent Mortgage that was taken out on this home.
Original Mortgage
$115,000
Interest Rate
5.68%
Mortgage Type
Fannie Mae Freddie Mac
Purchase Details
Closed on
Dec 31, 2004
Sold by
Evans Mamie
Bought by
Great Lakes Trust Co Na and Trust #04126
Create a Home Valuation Report for This Property
The Home Valuation Report is an in-depth analysis detailing your home's value as well as a comparison with similar homes in the area
Home Values in the Area
Average Home Value in this Area
Purchase History
| Date | Buyer | Sale Price | Title Company |
|---|---|---|---|
| Lattimore Frances J | $163,000 | Atg | |
| Jackson Pamela F | $115,000 | First American Title | |
| Great Lakes Trust Co Na | -- | -- |
Source: Public Records
Mortgage History
| Date | Status | Borrower | Loan Amount |
|---|---|---|---|
| Open | Lattimore Frances J | $163,000 | |
| Previous Owner | Jackson Pamela F | $115,000 |
Source: Public Records
Tax History
| Year | Tax Paid | Tax Assessment Tax Assessment Total Assessment is a certain percentage of the fair market value that is determined by local assessors to be the total taxable value of land and additions on the property. | Land | Improvement |
|---|---|---|---|---|
| 2025 | $461 | $10,500 | $2,344 | $8,156 |
| 2024 | $461 | $10,500 | $2,344 | $8,156 |
| 2023 | $428 | $5,500 | $3,906 | $1,594 |
| 2022 | $428 | $5,500 | $3,906 | $1,594 |
| 2021 | $436 | $5,499 | $3,906 | $1,593 |
| 2020 | $1,989 | $12,029 | $2,812 | $9,217 |
| 2019 | $1,996 | $13,366 | $2,812 | $10,554 |
| 2018 | $1,962 | $13,366 | $2,812 | $10,554 |
| 2017 | $1,752 | $11,516 | $2,500 | $9,016 |
| 2016 | $1,806 | $11,516 | $2,500 | $9,016 |
| 2015 | $1,630 | $11,516 | $2,500 | $9,016 |
| 2014 | $1,596 | $11,168 | $2,187 | $8,981 |
| 2013 | $1,919 | $13,179 | $2,187 | $10,992 |
Source: Public Records
Map
Nearby Homes
- 430 E 88th Place
- 435 E 88th Place
- 508 E 87th St
- 602 E 88th Place
- 609 E 88th Place
- 429 E 89th St
- 545 E 86th St
- 446 E 90th St
- 315 E 87th St
- 612 E 90th St
- 8534 S Rhodes Ave
- 8605 S Calumet Ave
- 8539 S Saint Lawrence Ave
- 735 E 88th St
- 736 E 88th St
- 743 E 88th St
- 701 E 89th Place
- 8826 S Prairie Ave
- 9020 S King Dr
- 624 E 90th Place
Your Personal Tour Guide
Ask me questions while you tour the home.