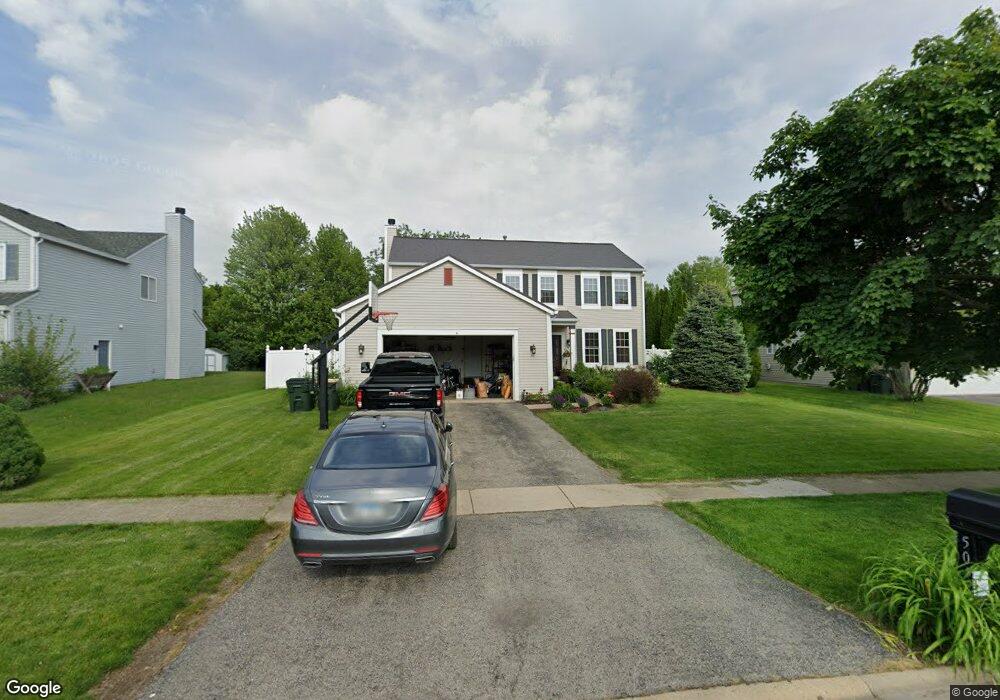
504 Rosebush Ln Unit 2 Oswego, IL 60543
South Oswego NeighborhoodEstimated Value: $409,000 - $443,000
4
Beds
3
Baths
2,261
Sq Ft
$191/Sq Ft
Est. Value
About This Home
This home is located at 504 Rosebush Ln Unit 2, Oswego, IL 60543 and is currently estimated at $430,777, approximately $190 per square foot. 504 Rosebush Ln Unit 2 is a home located in Kendall County with nearby schools including Prairie Point Elementary School, Traughber Junior High School, and Oswego High School.
Ownership History
Date
Name
Owned For
Owner Type
Purchase Details
Closed on
Sep 30, 2002
Sold by
Malatt Roger S and Malatt Amy E
Bought by
Wilkerson Michael
Current Estimated Value
Home Financials for this Owner
Home Financials are based on the most recent Mortgage that was taken out on this home.
Original Mortgage
$232,688
Outstanding Balance
$99,191
Interest Rate
6.39%
Mortgage Type
FHA
Estimated Equity
$331,586
Purchase Details
Closed on
Aug 20, 1999
Sold by
Montalbano Builders Inc
Bought by
Mallatt Roger S and Mallatt Amy E
Home Financials for this Owner
Home Financials are based on the most recent Mortgage that was taken out on this home.
Original Mortgage
$153,800
Interest Rate
7.61%
Create a Home Valuation Report for This Property
The Home Valuation Report is an in-depth analysis detailing your home's value as well as a comparison with similar homes in the area
Home Values in the Area
Average Home Value in this Area
Purchase History
| Date | Buyer | Sale Price | Title Company |
|---|---|---|---|
| Wilkerson Michael | $236,000 | -- | |
| Mallatt Roger S | $192,500 | Chicago Title Insurance Co |
Source: Public Records
Mortgage History
| Date | Status | Borrower | Loan Amount |
|---|---|---|---|
| Open | Wilkerson Michael | $232,688 | |
| Previous Owner | Mallatt Roger S | $153,800 | |
| Closed | Mallatt Roger S | $12,300 |
Source: Public Records
Tax History Compared to Growth
Tax History
| Year | Tax Paid | Tax Assessment Tax Assessment Total Assessment is a certain percentage of the fair market value that is determined by local assessors to be the total taxable value of land and additions on the property. | Land | Improvement |
|---|---|---|---|---|
| 2024 | $9,206 | $120,405 | $25,607 | $94,798 |
| 2023 | $8,287 | $106,553 | $22,661 | $83,892 |
| 2022 | $8,287 | $97,755 | $20,790 | $76,965 |
| 2021 | $7,755 | $88,868 | $18,900 | $69,968 |
| 2020 | $7,432 | $84,636 | $18,000 | $66,636 |
| 2019 | $7,816 | $87,413 | $18,000 | $69,413 |
| 2018 | $7,639 | $84,235 | $17,413 | $66,822 |
| 2017 | $7,457 | $78,724 | $16,274 | $62,450 |
| 2016 | $7,137 | $74,620 | $15,426 | $59,194 |
| 2015 | $7,248 | $72,447 | $14,977 | $57,470 |
| 2014 | -- | $68,346 | $14,129 | $54,217 |
| 2013 | -- | $69,037 | $14,272 | $54,765 |
Source: Public Records
Map
Nearby Homes
- 315 White Pines Ln
- 714 Pinehurst Ln
- 483 Deerfield Dr
- 395 Danforth Dr
- 538 Sudbury Cir
- 406 Windsor Dr
- 482 Deerfield Dr
- 616 Briarwood Ln
- 668 Cumberland Ln
- 639 Vista Dr
- 676 Cumberland Ln
- 851 Claridge Dr
- 673 Cumberland Ln
- 770 Dartmouth Ln
- 777 Dartmouth Ln
- 609 Chestnut Dr
- 206 E Washington St
- 210 Dorset Ave
- 114 Riverview Ct
- 94 Templeton Dr
- 506 Rosebush Ln
- 502 Rosebush Ln
- 626 Carnation Dr Unit 6
- 508 Rosebush Ln
- 504 Chateaux Ct
- 628 Carnation Dr
- 503 Rosebush Ln
- 505 Rosebush Ln
- 506 Chateaux Ct
- 510 Rosebush Ln
- 501 Rosebush Ln
- 507 Rosebush Ln
- 502 Chateaux Ct Unit 6
- 625 Carnation Dr
- 509 Rosebush Ln
- 630 Carnation Dr Unit 6
- 623 Carnation Dr
- 627 Carnation Dr
- 621 Carnation Dr
- 512 Rosebush Ln