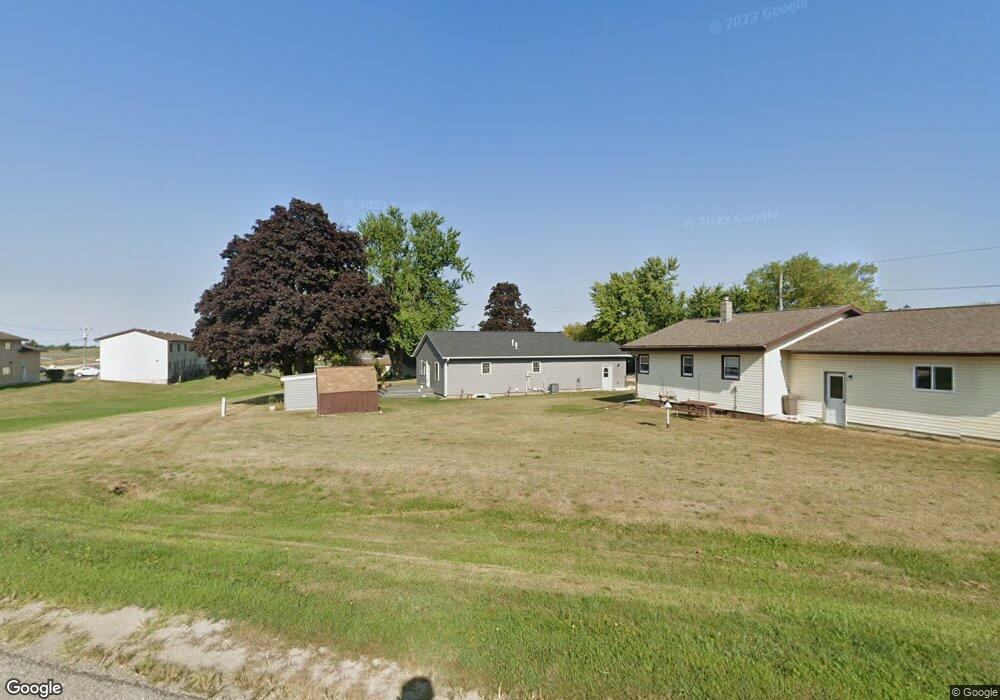
504 W Maple St Calmar, IA 52132
Estimated Value: $191,000 - $254,000
3
Beds
3
Baths
952
Sq Ft
$225/Sq Ft
Est. Value
About This Home
This home is located at 504 W Maple St, Calmar, IA 52132 and is currently estimated at $213,741, approximately $224 per square foot. 504 W Maple St is a home located in Winneshiek County with nearby schools including South Winneshiek Elementary School, South Winneshiek Middle School, and South Winneshiek High School.
Ownership History
Date
Name
Owned For
Owner Type
Purchase Details
Closed on
Oct 29, 2021
Sold by
Winneshiek County Habitat For Humanity I
Bought by
Kuboushek Lori
Current Estimated Value
Home Financials for this Owner
Home Financials are based on the most recent Mortgage that was taken out on this home.
Original Mortgage
$169,300
Outstanding Balance
$154,720
Interest Rate
2.8%
Mortgage Type
New Conventional
Estimated Equity
$59,021
Purchase Details
Closed on
Jan 2, 2019
Sold by
Kinkor Roger D
Bought by
Winneshiek County Habitat
Create a Home Valuation Report for This Property
The Home Valuation Report is an in-depth analysis detailing your home's value as well as a comparison with similar homes in the area
Home Values in the Area
Average Home Value in this Area
Purchase History
| Date | Buyer | Sale Price | Title Company |
|---|---|---|---|
| Kuboushek Lori | $169,500 | None Listed On Document | |
| Winneshiek County Habitat | $25,000 | -- |
Source: Public Records
Mortgage History
| Date | Status | Borrower | Loan Amount |
|---|---|---|---|
| Open | Kuboushek Lori | $169,300 |
Source: Public Records
Tax History Compared to Growth
Tax History
| Year | Tax Paid | Tax Assessment Tax Assessment Total Assessment is a certain percentage of the fair market value that is determined by local assessors to be the total taxable value of land and additions on the property. | Land | Improvement |
|---|---|---|---|---|
| 2024 | $2,610 | $162,570 | $15,830 | $146,740 |
| 2023 | $2,566 | $162,570 | $15,830 | $146,740 |
| 2022 | $2,566 | $142,130 | $13,200 | $128,930 |
| 2021 | $696 | $122,570 | $23,810 | $98,760 |
| 2020 | $696 | $35,810 | $23,810 | $12,000 |
| 2019 | $538 | $86,070 | $0 | $0 |
| 2018 | $1,642 | $86,070 | $0 | $0 |
| 2017 | $1,852 | $94,130 | $0 | $0 |
| 2016 | $1,772 | $94,130 | $0 | $0 |
| 2015 | $1,740 | $90,510 | $0 | $0 |
| 2014 | $1,658 | $90,510 | $0 | $0 |
Source: Public Records
Map
Nearby Homes