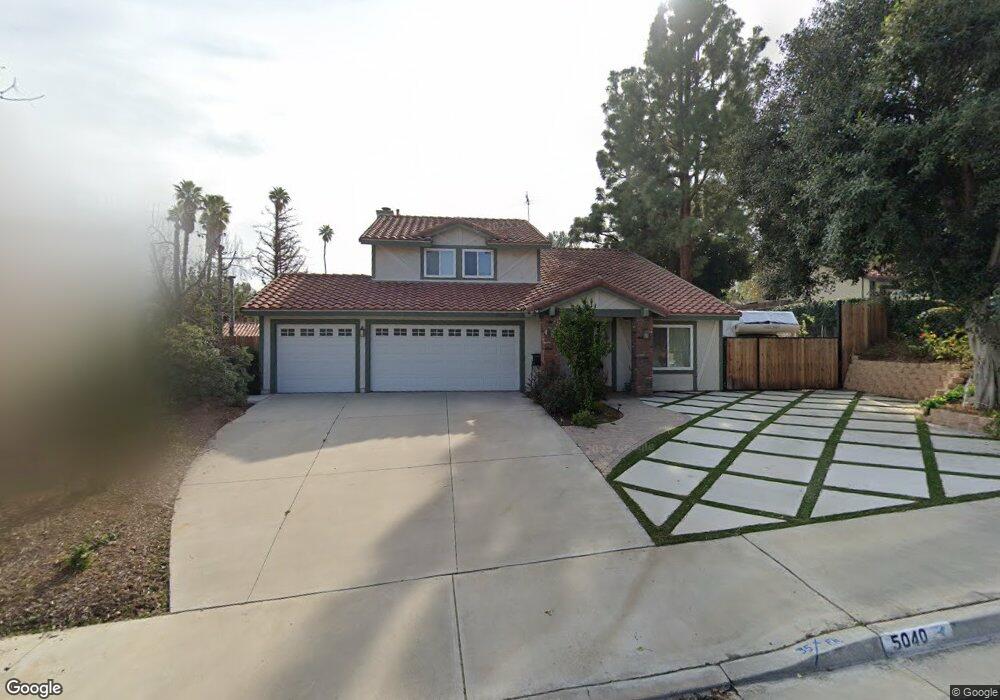
5040 Monte Carlo Ct Riverside, CA 92507
Canyon Crest NeighborhoodEstimated Value: $676,826 - $806,000
4
Beds
3
Baths
2,041
Sq Ft
$354/Sq Ft
Est. Value
About This Home
This home is located at 5040 Monte Carlo Ct, Riverside, CA 92507 and is currently estimated at $721,957, approximately $353 per square foot. 5040 Monte Carlo Ct is a home located in Riverside County with nearby schools including Emerson Elementary School, University Heights Middle School, and John W. North High School.
Ownership History
Date
Name
Owned For
Owner Type
Purchase Details
Closed on
Nov 3, 2017
Sold by
Johnson Kent and Johnson Natalie
Bought by
Johnson Kent and Johnson Natalie
Current Estimated Value
Purchase Details
Closed on
Sep 26, 2001
Sold by
Weeks Timothy D and Weeks Kathleen A
Bought by
Johnson Kent and Johnson Natalie
Home Financials for this Owner
Home Financials are based on the most recent Mortgage that was taken out on this home.
Original Mortgage
$230,000
Outstanding Balance
$90,162
Interest Rate
6.91%
Estimated Equity
$631,795
Purchase Details
Closed on
Nov 22, 1994
Sold by
Weeks Timothy D and Weeks Kathleen
Bought by
Weeks Timothy D and Weeks Kathleen A
Purchase Details
Closed on
Sep 23, 1993
Sold by
Federal Home Loan Mortgage Corporation
Bought by
Weeks Timothy D and Weeks Kathleen
Home Financials for this Owner
Home Financials are based on the most recent Mortgage that was taken out on this home.
Original Mortgage
$142,737
Interest Rate
6.91%
Mortgage Type
FHA
Create a Home Valuation Report for This Property
The Home Valuation Report is an in-depth analysis detailing your home's value as well as a comparison with similar homes in the area
Home Values in the Area
Average Home Value in this Area
Purchase History
| Date | Buyer | Sale Price | Title Company |
|---|---|---|---|
| Johnson Kent | -- | None Available | |
| Johnson Kent | $230,000 | Old Republic Title Company | |
| Weeks Timothy D | -- | -- | |
| Weeks Timothy D | $288,000 | Commonwealth Land Title |
Source: Public Records
Mortgage History
| Date | Status | Borrower | Loan Amount |
|---|---|---|---|
| Open | Johnson Kent | $230,000 | |
| Previous Owner | Weeks Timothy D | $142,737 |
Source: Public Records
Tax History
| Year | Tax Paid | Tax Assessment Tax Assessment Total Assessment is a certain percentage of the fair market value that is determined by local assessors to be the total taxable value of land and additions on the property. | Land | Improvement |
|---|---|---|---|---|
| 2025 | $3,635 | $339,748 | $88,621 | $251,127 |
| 2023 | $3,635 | $326,557 | $85,181 | $241,376 |
| 2022 | $3,550 | $320,155 | $83,511 | $236,644 |
| 2021 | $3,507 | $313,878 | $81,874 | $232,004 |
| 2020 | $3,480 | $310,661 | $81,035 | $229,626 |
| 2019 | $3,414 | $304,571 | $79,447 | $225,124 |
| 2018 | $3,346 | $298,600 | $77,891 | $220,709 |
| 2017 | $3,286 | $292,746 | $76,364 | $216,382 |
| 2016 | $3,074 | $287,007 | $74,867 | $212,140 |
| 2015 | $3,030 | $282,698 | $73,744 | $208,954 |
| 2014 | $3,000 | $277,162 | $72,300 | $204,862 |
Source: Public Records
Map
Nearby Homes
- 1040 Central Ave Unit 14
- 1000 Central Ave Unit 8
- 4967 Chapala Dr
- 876 Via Mesa Verde
- 5110 Caldera Ct
- 5555 Canyon Crest Dr Unit 2G
- 718 Via la Paloma
- 511 Athens St
- 5600 Via Junipero Serra
- 5015 Treehill Place
- 680 Via Zapata
- 600 Central Ave Unit 291
- 600 Central Ave Unit 374
- 1450 Via Vallarta
- 700 Via Concepcion
- 375 Central Ave Unit 124
- 375 Central Ave Unit 14
- 375 Central Ave Unit 24
- 375 Central Ave Unit 83
- 547 Via Zapata
- 5030 Monte Carlo Ct
- 5050 Monte Carlo Ct
- 910 Le Conte Dr
- 930 Le Conte Dr
- 5035 Monte Carlo Ct
- 5020 Monte Carlo Ct
- 909 Le Conte Dr
- 5060 Monte Carlo Ct
- 940 Le Conte Dr
- 5025 Monte Carlo Ct
- 950 Le Conte Dr
- 915 Le Conte Dr
- 5010 Monte Carlo Ct
- 5015 Monte Carlo Ct
- 5032 Colina Way
- 1117 Maddie Ln
- 5173 Colina Way
- 1131 Maddie Ln
- 5022 Colina Way
- 1109 Maddie Ln
Your Personal Tour Guide
Ask me questions while you tour the home.